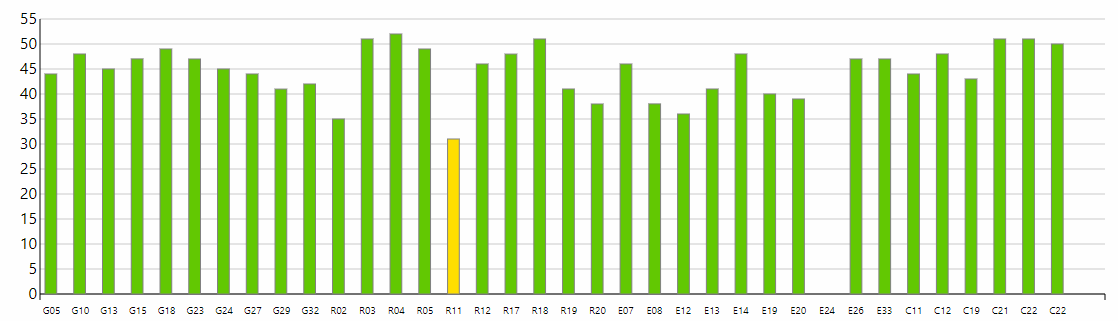
I setup my own RTKBase and am super happy with it so far, but a potentially dumb question I have is how do I read this graph that I have pictured. Obviously, I have gathered that green is good but I do not know what the G05 - C22 stands for and what the 0-55 on the verticle axis is representing. Any guidance would be helpful.
2 Likes
See this issue that explains all: Improve reading of the satellite graph · Issue #273 · Stefal/rtkbase · GitHub
I added a note to the linked enhancement request. The readings looks like C/N0 (carrier-to-noise density) readings which are expressing dB-Hz vice dB.
From Varipos.com, “The ratio of the power level of a signal carrier to the noise power in a 1-Hz bandwidth. This is a key parameter in the analysis of GPS receiver performance. Nominal GPS receiver C/N0 values often are in the 40 to 50-dB-Hz range.”
From Ublox GNSS Antennas paper, “A GNSS receiver will only achieve the specified performance if
the average carrier to noise power density ratio (C/N0) of the strongest satellites reaches at least
44 dBHz. In a well-designed system, the average of the C/N0 ratio of high elevation satellites should
be in the range between 44 dBHz and about 50 dBHz.”
In case you missed it in the linked picture, the G satellites are GPS, R is Glonass, E is Galileo, C is Beido.
I believe it’s possible to manually change the F9P configuration with U center so that RTKBase will only show the constellations you want (2 constellations display a lot better on phone screens than 4 constellations), but if you use that configure button in RTKBadr then it will config the F9P to send all.
What is enought to rtk base? GPS, glonas, Galileo? Or GPS and Galileo? I’m from Poland