We were discussing about height maps, it looks we’d need the following data:
heighmap.txt
epoch, Lat, Lon, Height, Heading, Roll, antenna height, workswitch
I think it could be stored similarly how we do sections.txt
Then using post process (or perhaps even during operation? ) we could enhance the data for higher resolution.
10Hz / per line and +2 extra lines based on roll?
Good idea!
With the help of this feature, the drainage routes can be easily designed on my waterlogged areas. In my opinion, collecting data every 20-30 square meters (relative to the width of the implement) should be sufficient for the purpose I would use it for.
Make sure you use orthometric heights for drainage design. Orthometric height datums are normally related to mean sea level and take into account the effect of gravity.
Wow I’ve been installing drain tile a long time and have never even thought about that. It looks like roughly 8in / mile according to google. It’s minimal but can add up. Thanks for knowledge!
Quora
That is some math from Quora. Average drop. Basically at sea. 8" per mile is .0126% slope. It’s squared so shorter distance would be much less slope. More distance much greater slope. I would say hardly noticable within laser range.
So the main thing is the curvature of the face of the earth, not that much from the local variation of gravity. Would be nice to see example figures for the latter but already the simple curvature surprised me. Should I say we luckily do not have 15 mile long fields as in the Quora example.
I’ve seen a demo with John Deere where they mentioned that to set up AB curve they had to manually drive on the AB to have it in the program. Meh…
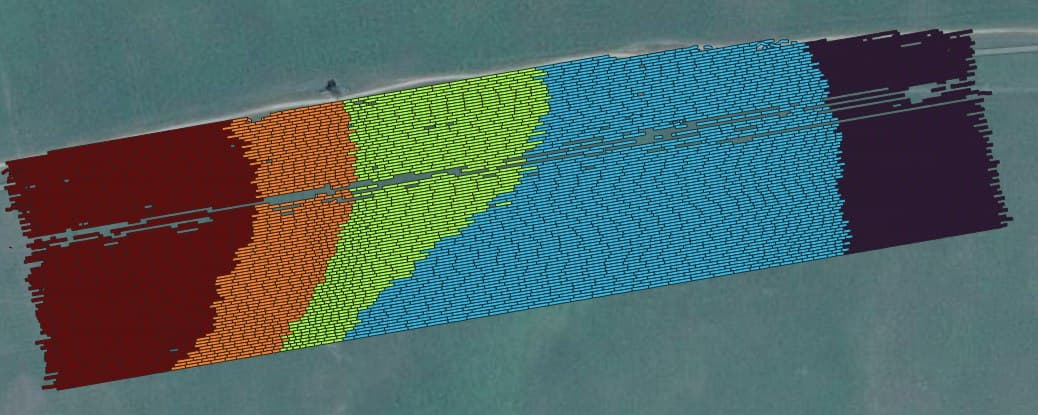
Video here (it’s in Hungarian but the drone shot is cool)
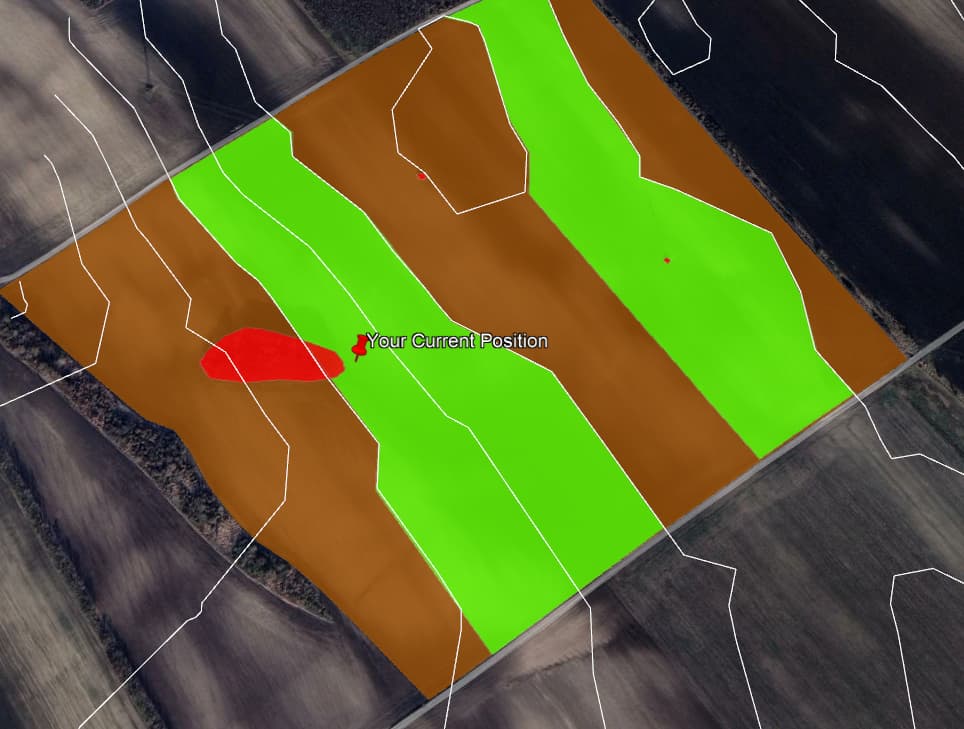
RED: some trees + 2 big electrical poles that we’d like to avoid.
GREEN: the 2 areas based on which we can create 4 contour lines.
How to add these in AOG?
Issue #1: for some reason KMZ doesn’t work.
Issue #2: for some reason we can only define AB curve on the outer boundary…
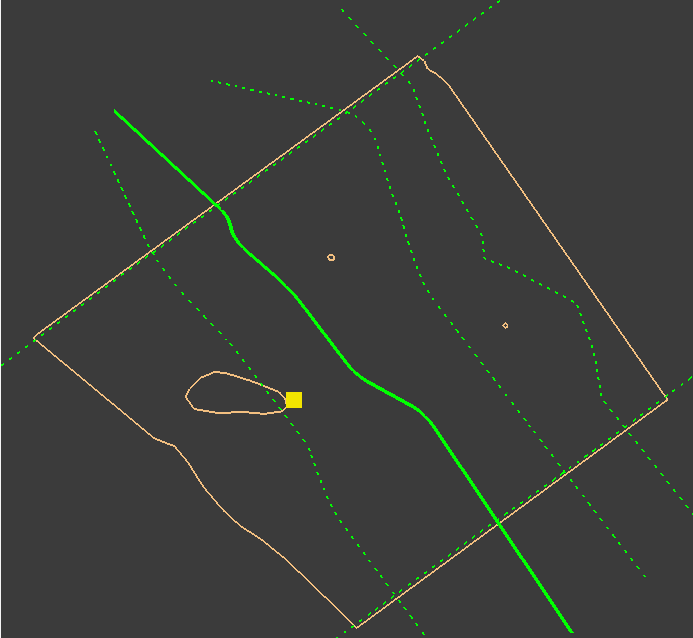
Workaround for #2:
I start by adding the GREEN areas and then use the overview button / function to draw my AB curve. (We’ll name / smooth them later.)
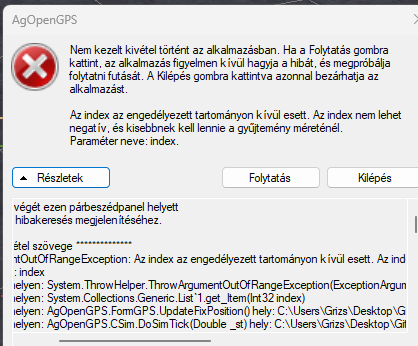
However when I try to use K-turn I get this error: (latest v5.7.3.1 )
(U-turn does work nicely, but sometimes the K turn is displayed as U turn, although I set my radius 5.00m and implement was 10.00m so probably that’s why)
Am I doing something wrong by defining AB curve from boundaries that no longer exists or I found a bug?
Files to reproduce: hektarpodcast.zip (113.9 KB)
I believe the old fault with AOG making 8 shape turns is fixed, but to rule out that issue, set radius to 4,95 m or 5,05 ( old fix for 8 shape issue doing u turn at half implement width)