Learning QGIS and want to map all my fields there.
Want to import various field registrations and flags from AOG to keep track of weed spots etc.
Does anyone have a “best practice” for mapping fields and things in fields?
1 - Is it best to keep all fields in one project, or separate projects for each field?
2 - One project pr year, or use layers for each year? E.g. “2023-weeds”
I haven’t used QGIS, learning about it is on my to do list. I’m here to learn. I’d like to do a better job with field record keeping.
I’d say: consider that you’ll want to be able to compare things to look for correlation, and lay data out so that is is easy to do so.
Say you have a narrow sliver of excellent yield in this year’s yield map and you’re not sure why, you want to try to figure out why. You’ll want to overlay this year’s tillage coverage map, or last year’s fertilizer application coverage log, or any other log to try to determine if a skip/overlap of an operation caused your narrow sliver of excellent yield.
You really don’t want to be opening/closing projects to compare, and having the same field open twice side by side isn’t ideal either. You want those two data sets right on top of each other if possible.
I don’t know QGIS enough to say, but I’d guess that you want layers for every operation, sorted by date. Maybe decide on a naming standard for layers with a date and description like “20230525 Cultivator” ?
Honestly you can’t rely on imagery for mapping at all. Your RTK coordinates are always going to be relative to your base station, so as your base station moves across the earth’s crust, the fields do as well, more or less at the same rate. But on Google Earth scales you have the movement of the earth’s crust, and the coordinate system Google uses. In North America, most survey mapping is done in NAD83 coordinates. This is known as the “datum” of your coordinates. And as you switch back and forth between the different datum, you will see offsets and alignment issues. Besides that, lining up all the images and making sure the features are all in the right place is not possible to get perfect. I have google maps updated imagery from a month ago that show distortions of straight features that are up to a metre off (wavy lines).
There might be a way to adjust the offset of a Google Maps tileset layer in QGIS to line it up with your own coordinates. Some day maybe I’ll use drone photography throughout the season as the underlying imagery layer, but that sounds like hard work to line things up.
Personally I keep everything I’m working on in one QGIS project. Then I can toggle the layers on and off that I want to see and work with. The number one hardest part in the learning curve of QGIS is the coordinate system (datum). Pretty much I use “EPGS:4326 - WGS 84” for everything. This is basically uncorrected latitude/longitude/altitude in degrees,and it’s what Google Maps uses, so my stuff roughly overlays it. If I use NAD83 (which is corrected for continental drift), then I get shapes that are skewed and deformed when overlayed on the google maps layer.
My needs and use cases for QGIS are somewhat esoteric. I’m not using AOG for mapping just yet. Mostly I use QGIS to visualize boundaries and AB lines I’ve created using a python script for my various fields. I have very precise coordinates of pivot points, so in many cases boundaries can be generated as pure circles based on those center coordinates. And AB lines are all done such that the pivot point divides the fields precisely in two halves, based on the heading I desire and the width of my machines.
I’ve done some analysis of mapping data in QGIS. I’ve found an interesting problem that some day I want to address in AOG. In all systems (including commercial ones), coverage is mapped based on where the implement is of course, not the tractor. But if you want precise elevation maps of your fields, you can’t use these coverage maps because the elevation readings don’t line up with where the coverage is laying down (unless you have gps on the implement itself). So for getting proper elevation maps, the elevation mapping has to be done separately from the coverage mapping. I don’t know of any commercial system that does this.
Looks like it’s best to map the fields by driving around the borders.
It’s also possible to create extra boundaries inside a field in AOG and make them drivethru or not.
How can this be done in QGIS? I can make a polygon on the boundary layer, but I can’t see this in AOG.
Hello everybody.
I loved the topic and have many contributions and interests.
QGIS is a powerful, free platform that allows precision agriculture studies.
I maintain several studies in QGIS, as some legal obligations in my country require these maps to be handed over to the authorities.
Some plots are identified and managed with this program. We use the WGS84 system to enter data into equipment systems and for precision agriculture studies we use SIRGAS 2000, which uses measurements in meters.
One of the routines I use a lot in QGIS is generating sampling points. From there, I transfer the points to software on my cell phone and collect the already identified collections. So when I receive the results, I transfer the data to an attribute table and obtain spatial and temporal variability graphs. Very useful for understanding the distribution of certain components in the soil.
Now comes the interesting point. I started using AGO to schedule the application of pesticides or fertilizer. These same paths could be used to evaluate productivity and make a correlation. Then the doubt arises. Does the AGO generate any type of record? There is the possibility of applying inputs at a variable rate, but can I generate real data from the application? With this I would import the data and we could study some interference or gains using the GPS data.
I am a lover of this technology and welcome any study to improve this experience.
I live in central Brazil and we work a lot with soy and corn production here.
I know AgLeader / Paradyme indicates it will capture elevation mapping in the background while performing other work. I haven’t gone back to systematically verify data so I can’t categoricaly say it does. I do know it requires solid RTK Fix for the entire operation or the data capture will fail.
So I could use this to view my QGIS project with my GPS location overlayed? That would be useful, I’m planning some yard improvements and so far my best idea was to use the drone to hover at waypoints where I want my flags etc. But thats a hassle.
I wonder what it would take to get RTK corrected location on the mobile device… Anyone know if thats possible?
Yes
Qfield app, and Qfield Sync plugin in Qgis
And you need to register for a QField cloud account (free)
That’s of my interest too. There should be a setting for gps under developer settings on Android to enable support. Not figured it out.
I already have the Lefebure app accepting corrections from my base station.
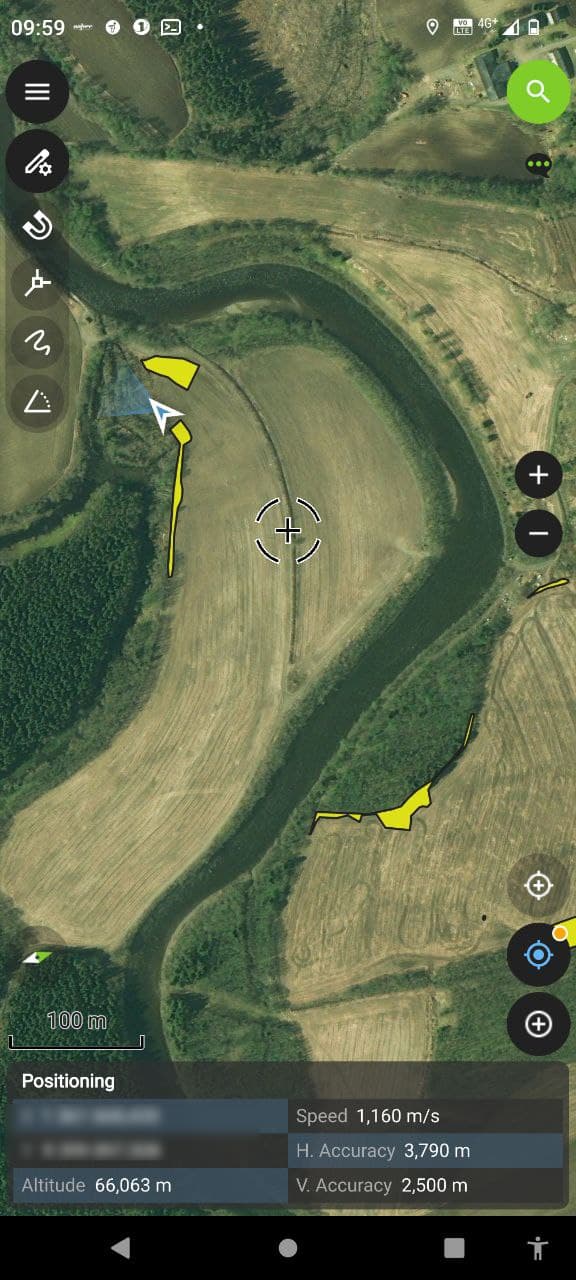
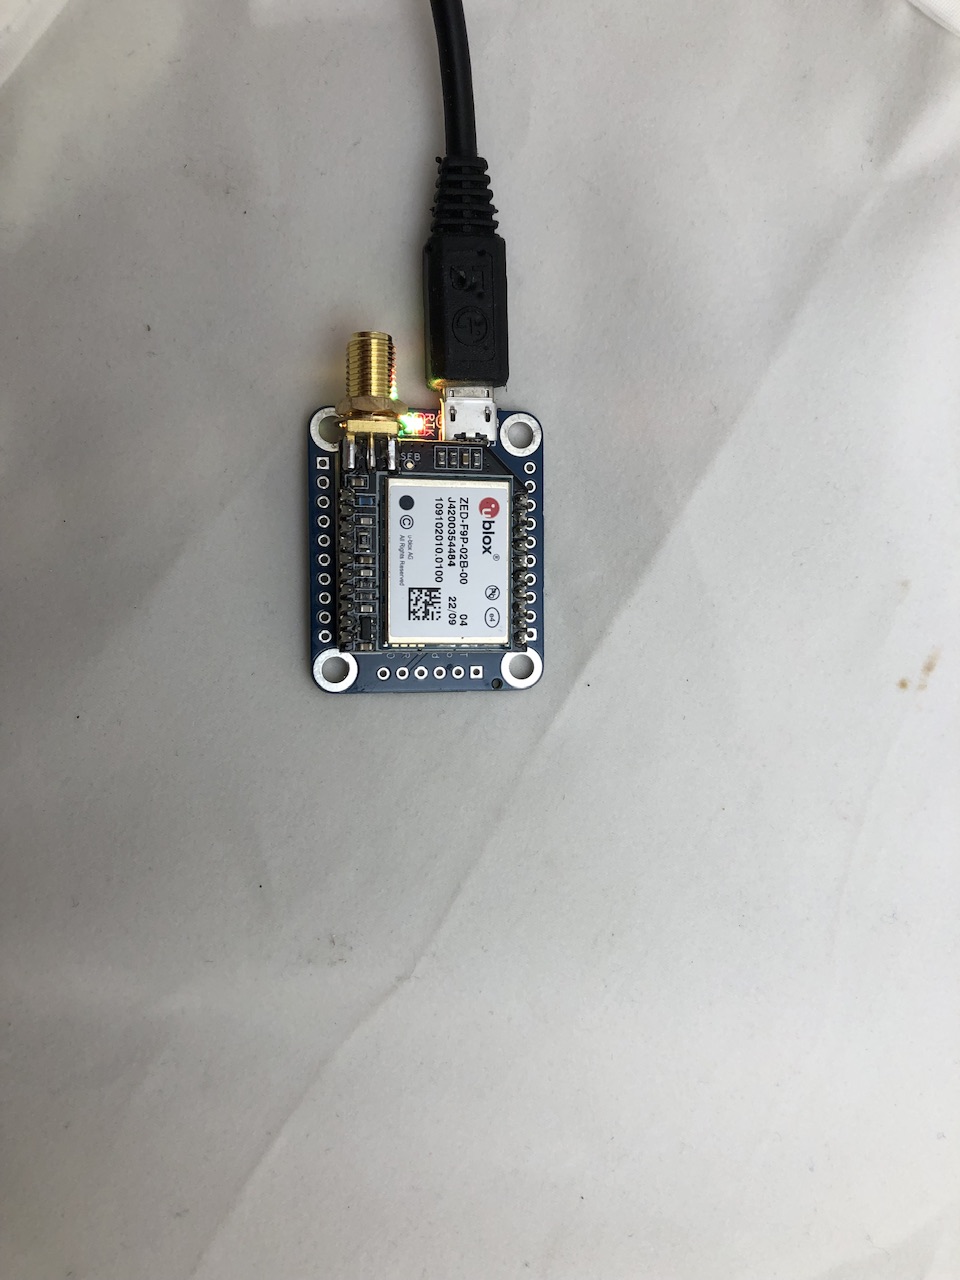
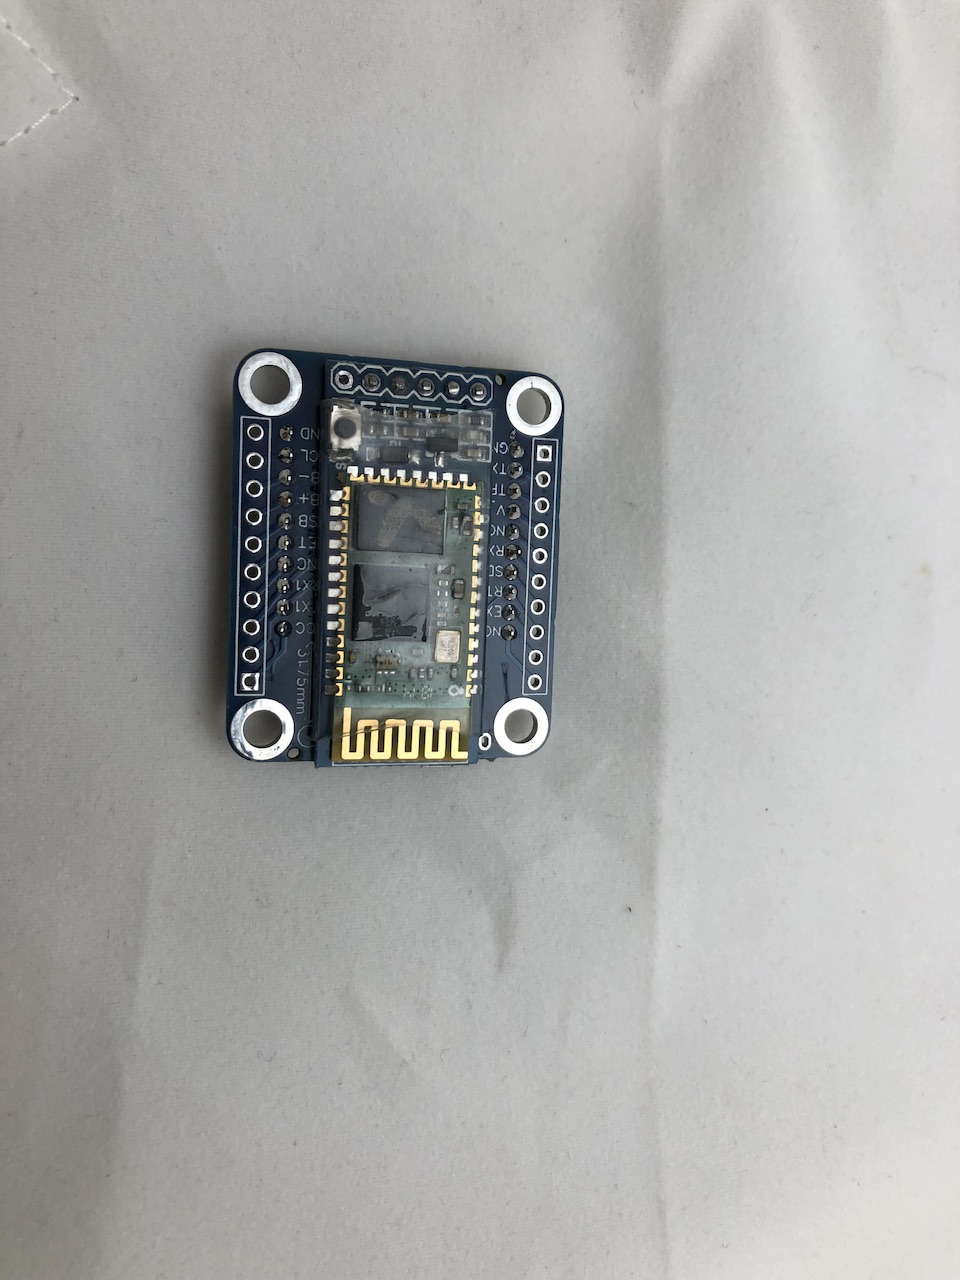
I use a homemade contraption consisting of 3d prints, an F9P, an HC05 bluetooth module, USB battery bank, and antenna. I connect this via bluetooth to an Android phone running GNSS Master app. The GNSS Master App handles the NTRIP connection to my base station, the bluetooth connection, and sends the corrected location to Android’s “mock location.” All other apps on the phone will then use the corrected location.
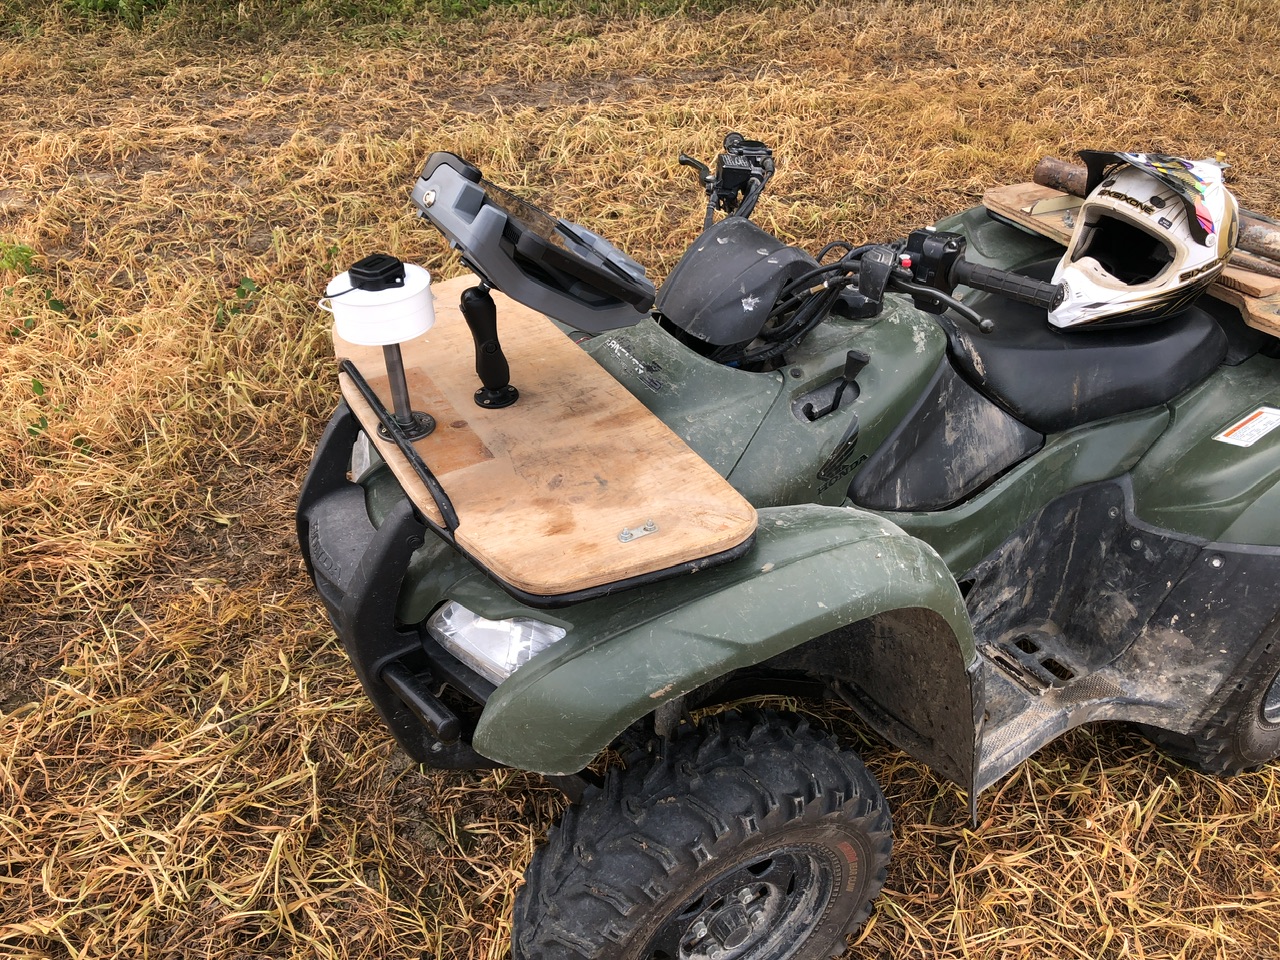
I can also bind the receiver over Bluetooth to a windows tablet running AOG or whatever. It’s pretty sweet on the ATV that way.
I’ve been using SW Maps and Google Earth and hand editing .klm files as necessary. Google Earth is limited in what it can do, I’ve downloaded QGIS for Windows now and will give it a run soon.