Managed to rewrite my script to cope with multiband setup now.
“perl-nmea/plot-CNR-from-GPGSV.pl at 0108 · wolfgangr/perl-nmea · GitHub”
To process 24 hrs of data logged by an UM982 with this stationary test setup
(view from the North)
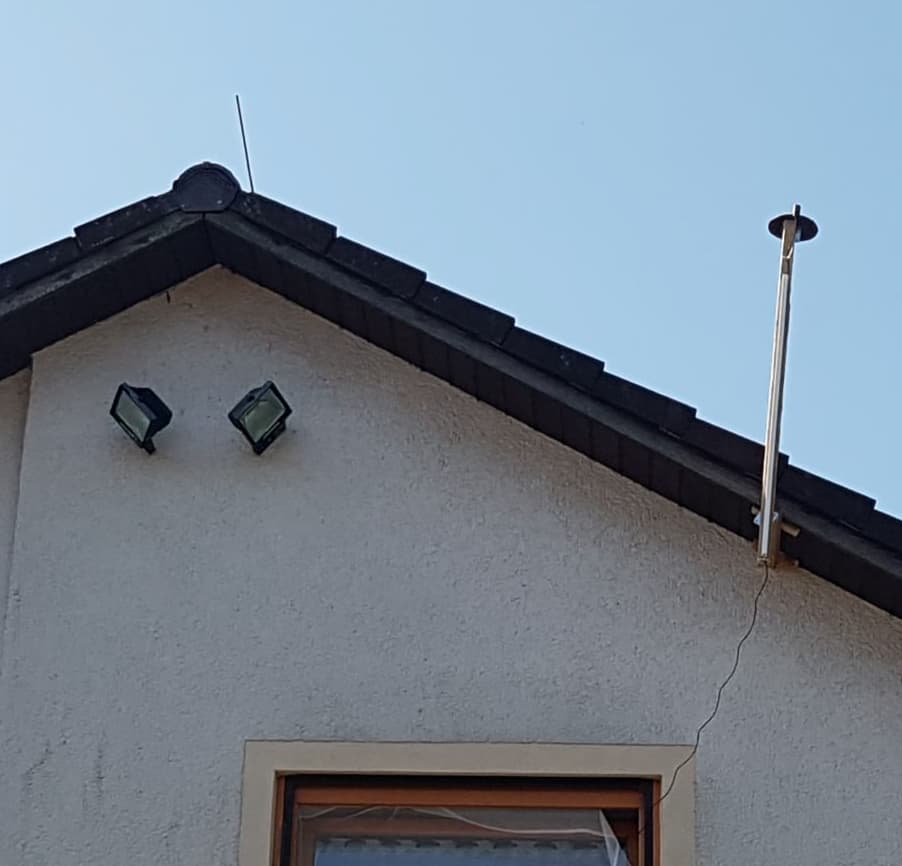
overloads my 16 GB workstation.
Good to have a 128 GB spare one… just to produce output to get drowned .. ![]()
One of my ideas was to overlay skyplot with the ublox sky-view.
However, nearly 200 tracks overlaid are too many trees hiding the forest:
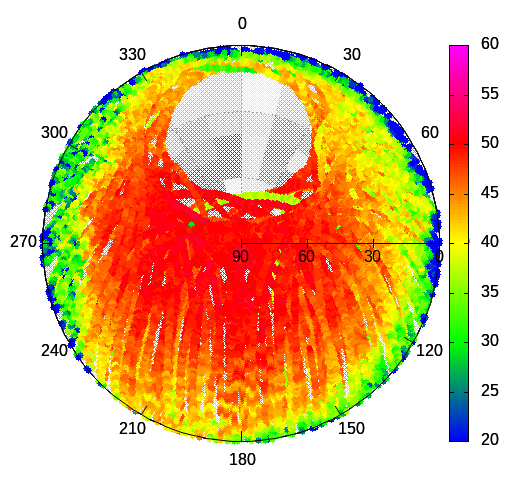
(both plots are color coded SNR over elevation and azimuth)
Can both images benath each other tell us more?
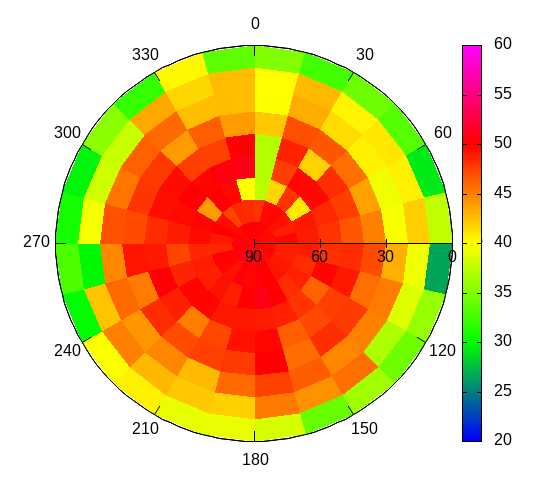
We might guess some obstruction in East-north-east, but actually there is really free view
In the “Gerstenberg-plot” …
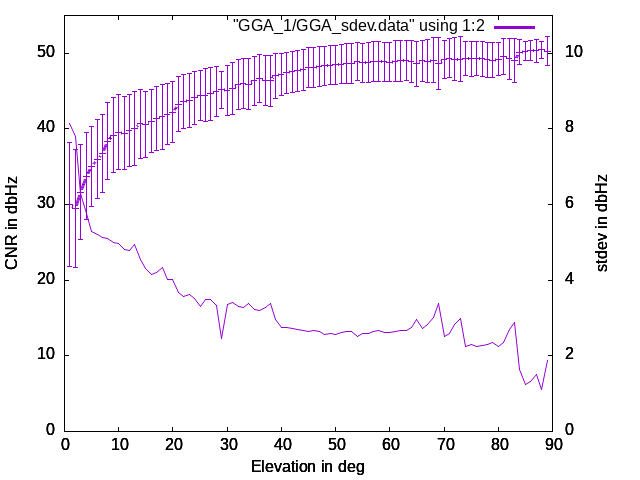
…we may identify some oscillations of CNR stdev between 70 and 90 deg.
However, there is unobstructed view beyond doubt, so we might find remnants of the antenna design. May be we can compare antennas thus?
And we may see oscillations between 10 and 40 deg elevation - where we expect the effects from obstructions close to the horizon.
In the hundereds of different per-sat/system/signal views, similiar patterns display clear distinctions, but it’s hard to find relevant information.
Would be nice at least to separate this information by azimuth, to get a clue where distortion comes from.
I tried to recall my old ideas of a “reverse hologram” still present at github. The idea was to map all those CNR-patterns into space to identify sources of reflections. But the numerical challenge of such an endeavour is immense.
Looks like I siply have to collect some experiments and see if there is something to see. ![]()
Anybody any idea / knowledge how a “perfect” groundplane for an AG-30 and how a “not-so-perfect” one look like?