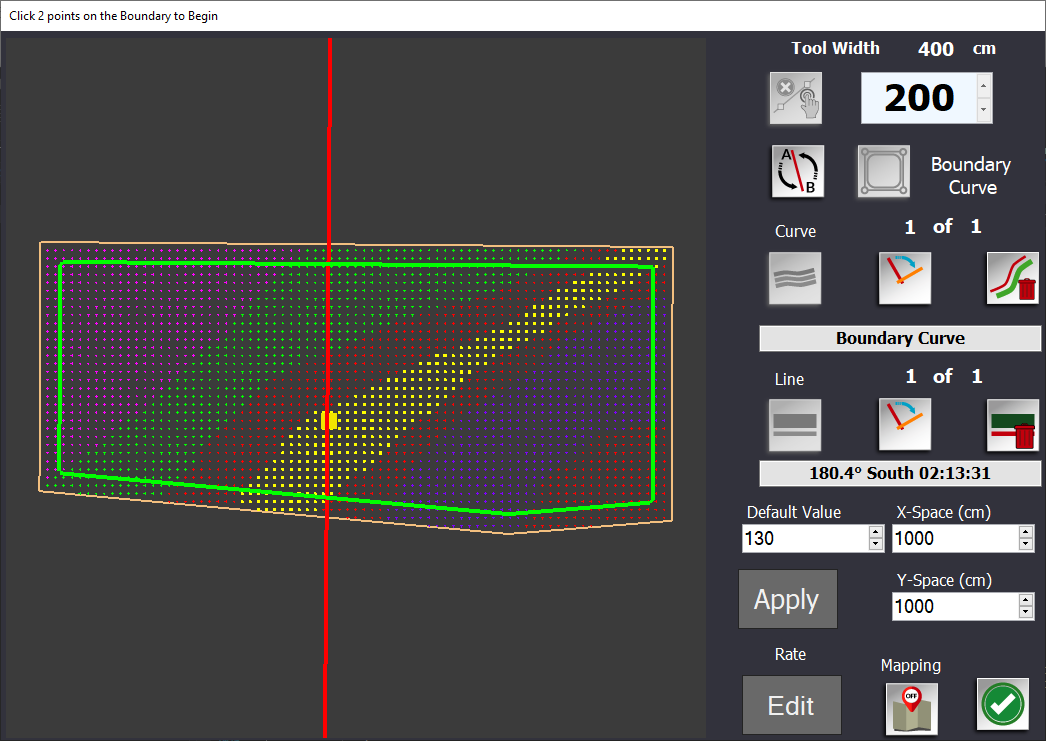
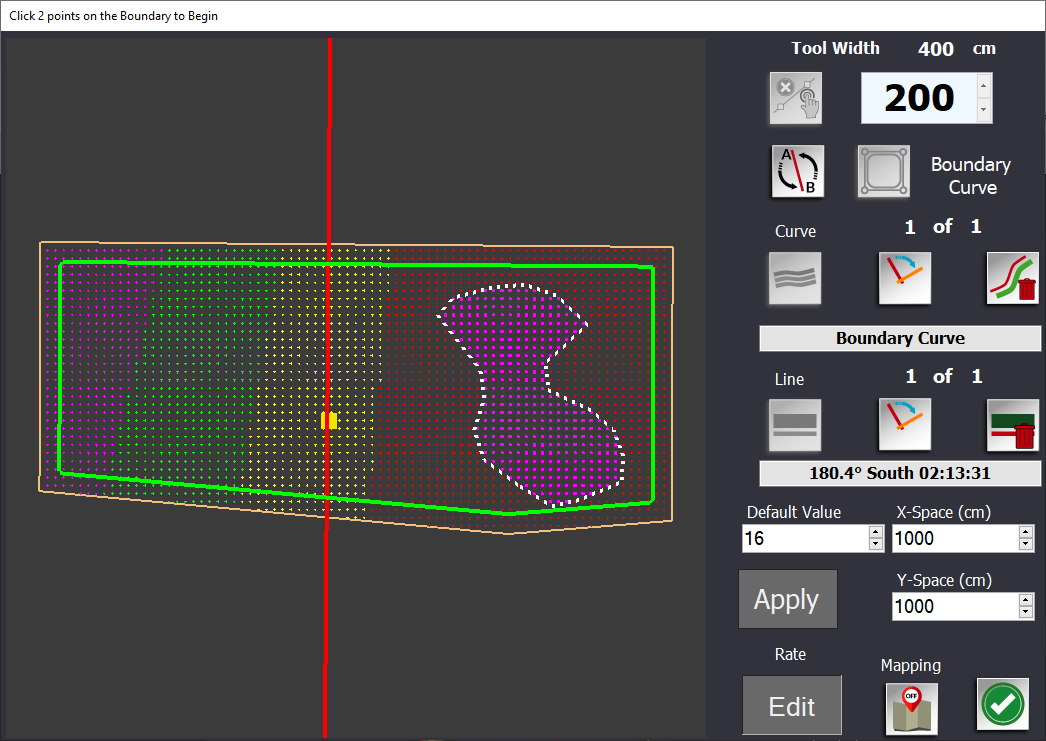
Making progress. It sets the default value for the field at what it is set to and builds a grid of points based on the spacing. You click edit and draw lines around what you want to change. Everything inside is changed to the new value.
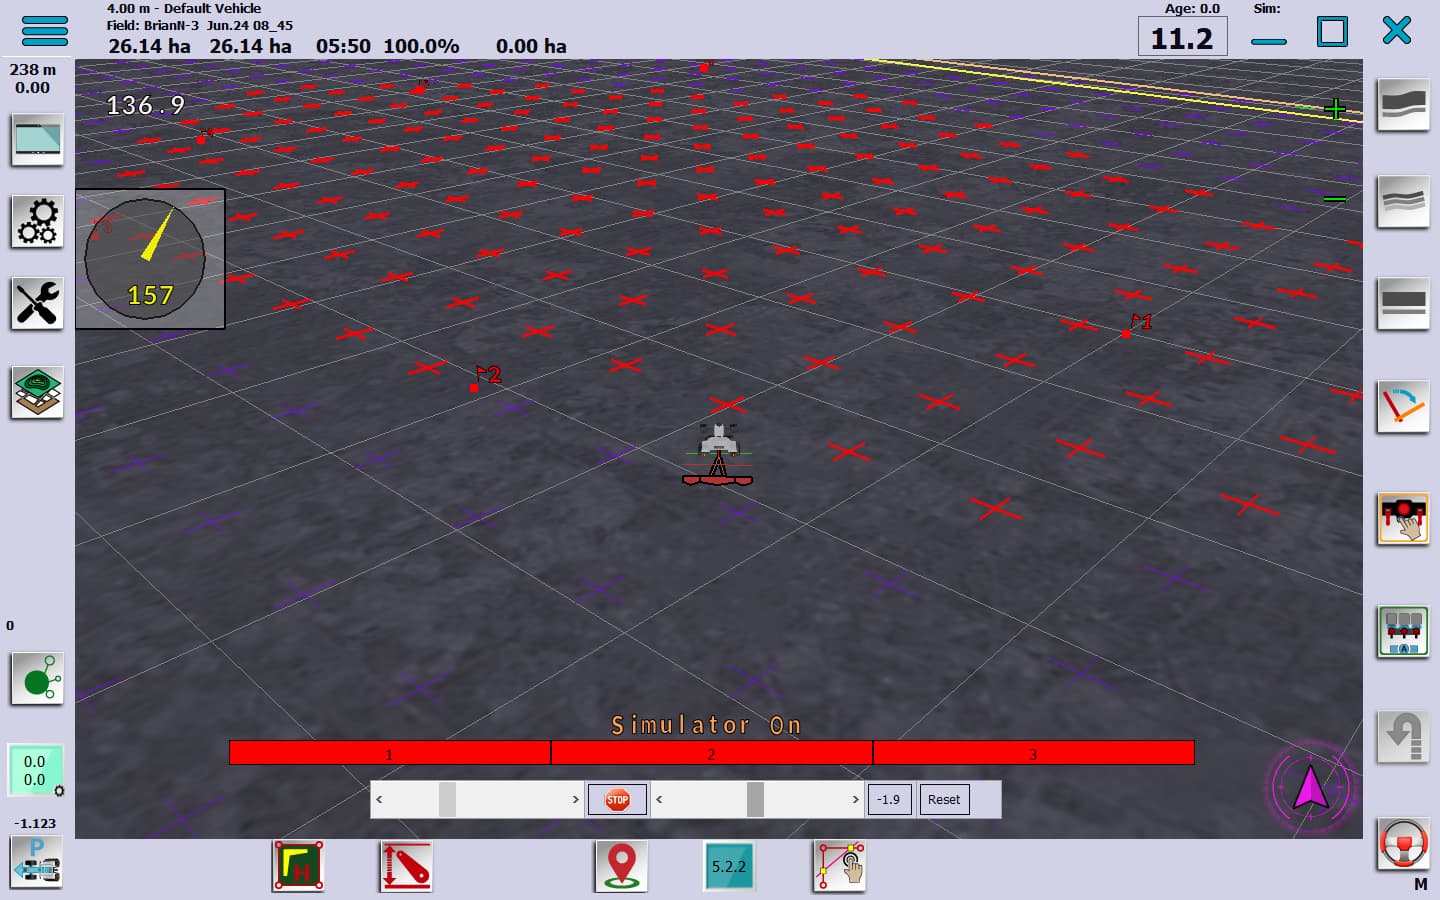
I think you can drop flags in the field and they show up on this screen.
Now to read these values and send then to the machine.ino.
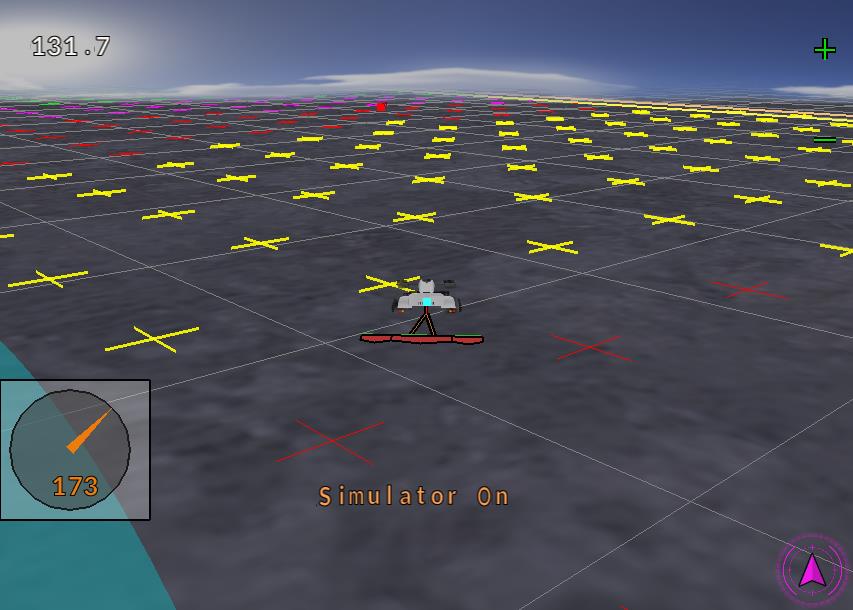
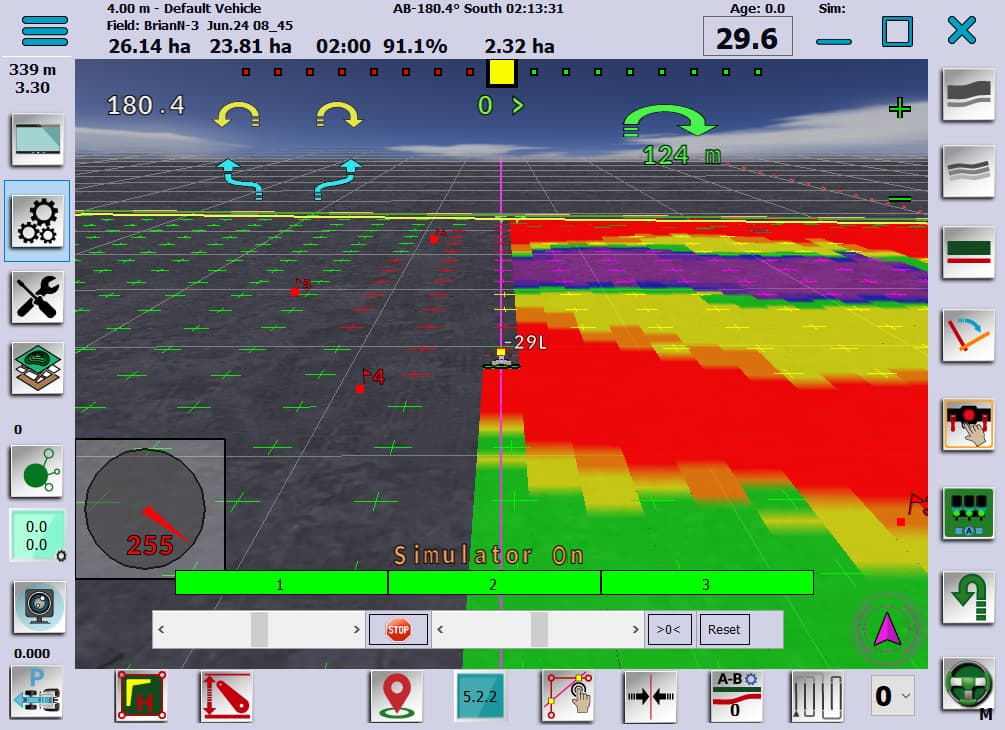
Maybe I’m just slow, but always wanted to save a jpg of the current status of the field. An Export Current View as image button. Oh boy it actually works. That means we should be able to print a report with images of the completed field. It is a feature I’ve wanted for a long time. Stumbled on this while building the rate. Thought it might interest some of you. I’ve some clean up to do, but here is the image.
It finds the four closest points and provides a weighted average based on distance. Naturally, large fields with a small spacing of points would be memory hungry. It is currently one rate for all the sections.
Update:
This picture is the screen capture jpg at the moment I clicked it. Notice it is not the whole program, just the graphics window. Lots of big work ahead on this.
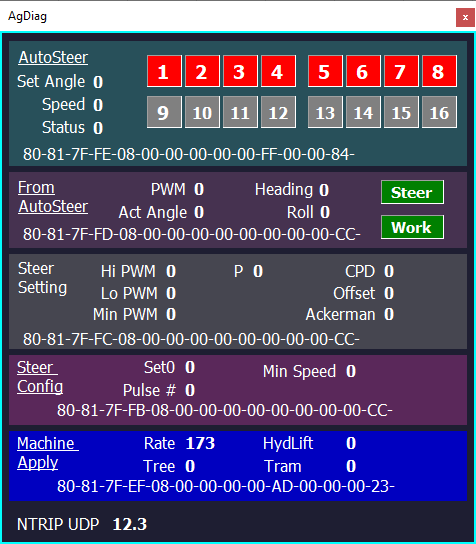
This has the machine byte added. Note the Rate is the 173 the same as the one in the above picture. That string is the machine byte. I’m using the 9 data which is the 10th number AD for the rate. Working well.
It is sending the data in the machine byte. I’ve modified the arduino code to read the value, but I do not know what to send to the arduino pins. Fairly certain that it is getting into the arduino as a value of 0 - 256. What do you want to do with it from there, and do you program your own in the arduino?
No reason why you could not use that for the 2 decimal places. I considered just limiting it from 0 to 100 percent. But can we apply rate to an accuracy of 2 decimal places. Using the 256 as the upper value, each click or 1/256 is 0.0039. That is pretty tight for rate control. We are not that accurate due to rounding and bit conversion coming out of the field grid.
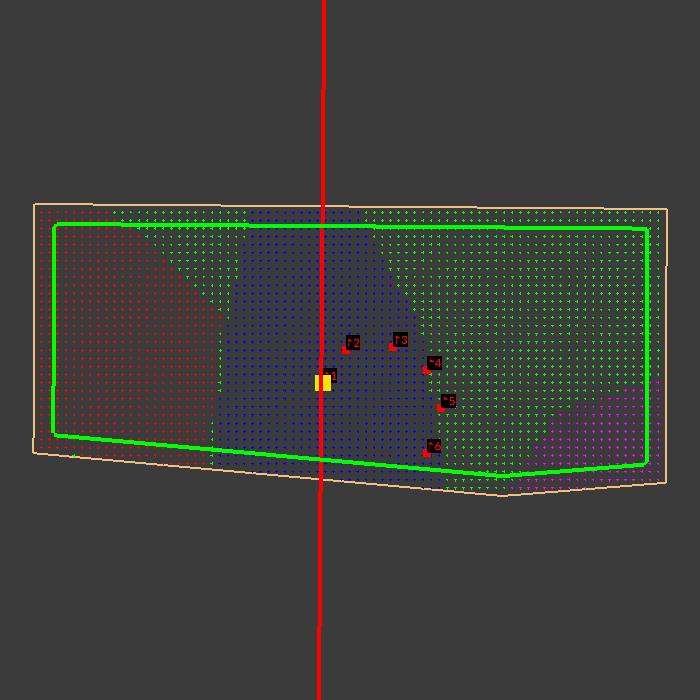
This is what the ABDraw screen currently looks like. The Rate information is at the bottom. Pick your x and y spacing. Even is always better. Too close will bog down a big field. Set the default value. Click the paint bucket. Click the pencil and click around a loop that you want to be different than the original. Set a new default value, and click the paint bucket. Repeat until you like it. Easier to do the bigger areas and work your way down to the smaller inside areas.
Percent might make more sense. The zone with the highest rate would be 100. The other zones would be a percentage of that. The actual rate could be defined elsewhere.
I am still thinking, if I use a linear servo could use the servo Library. Or if I use a linear actuator I need a motor driver and a potentiometer to stop it at the right place.
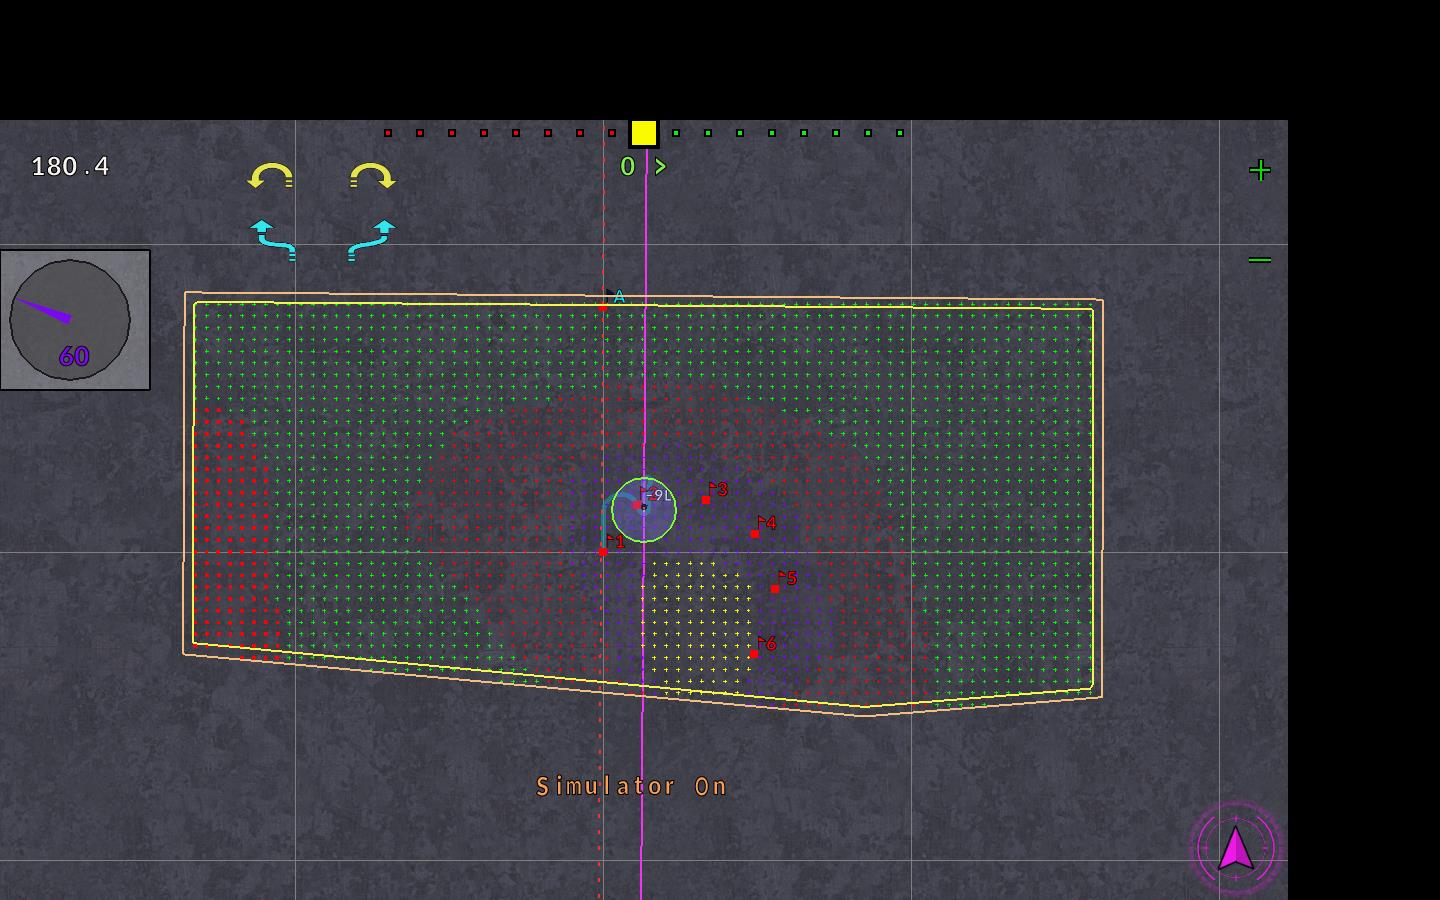
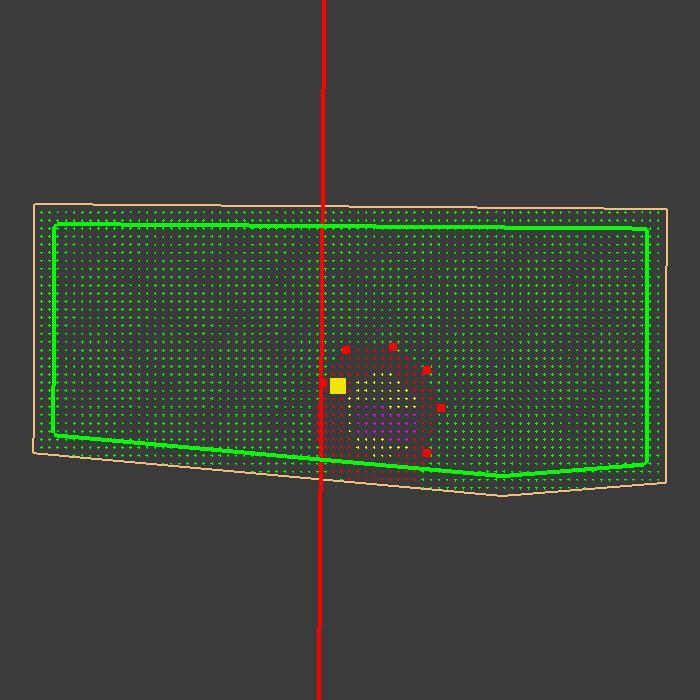
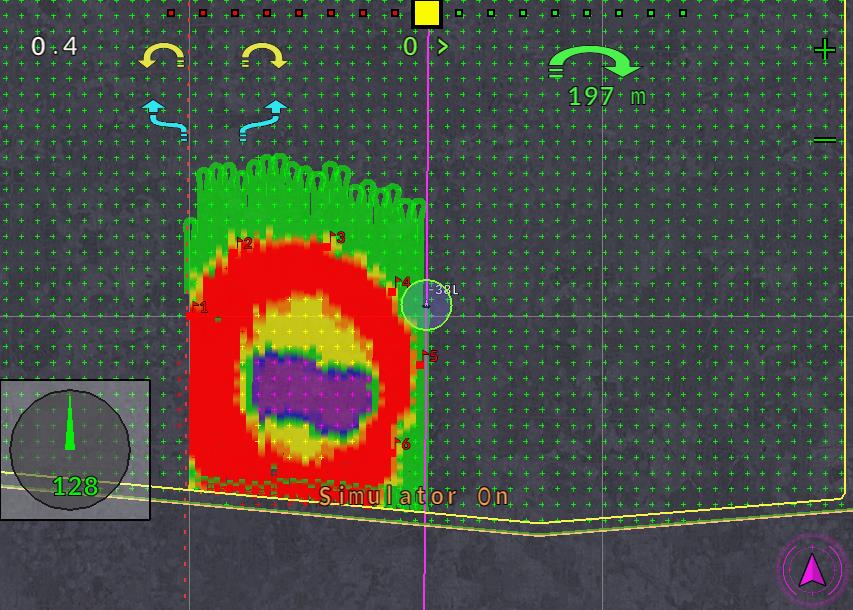
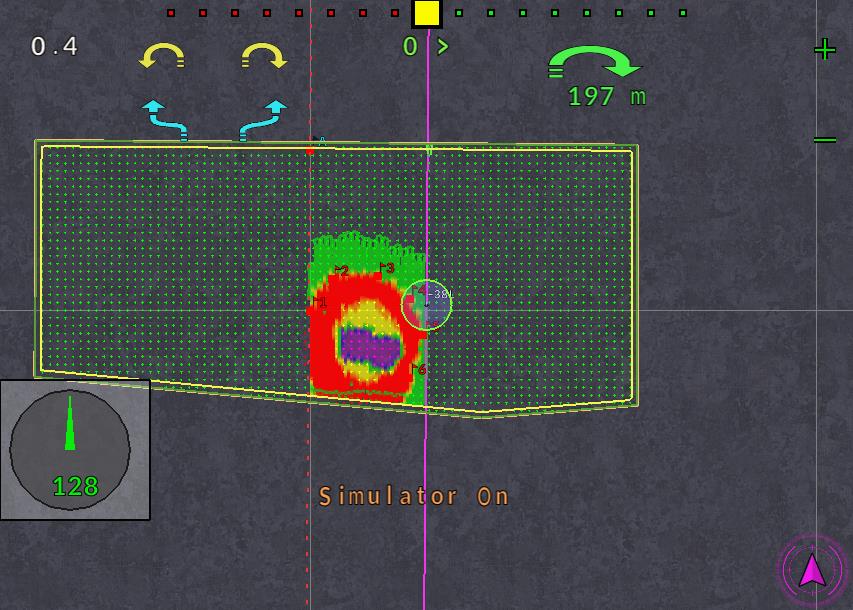
Converted the sections to paint the color of the rate. The following show the planned field then the applied area painted to the color of the rate at those areas. Interesting. These are actually exported jpg files from inside of AOG. These are not screen shots cropped to remove the other things.
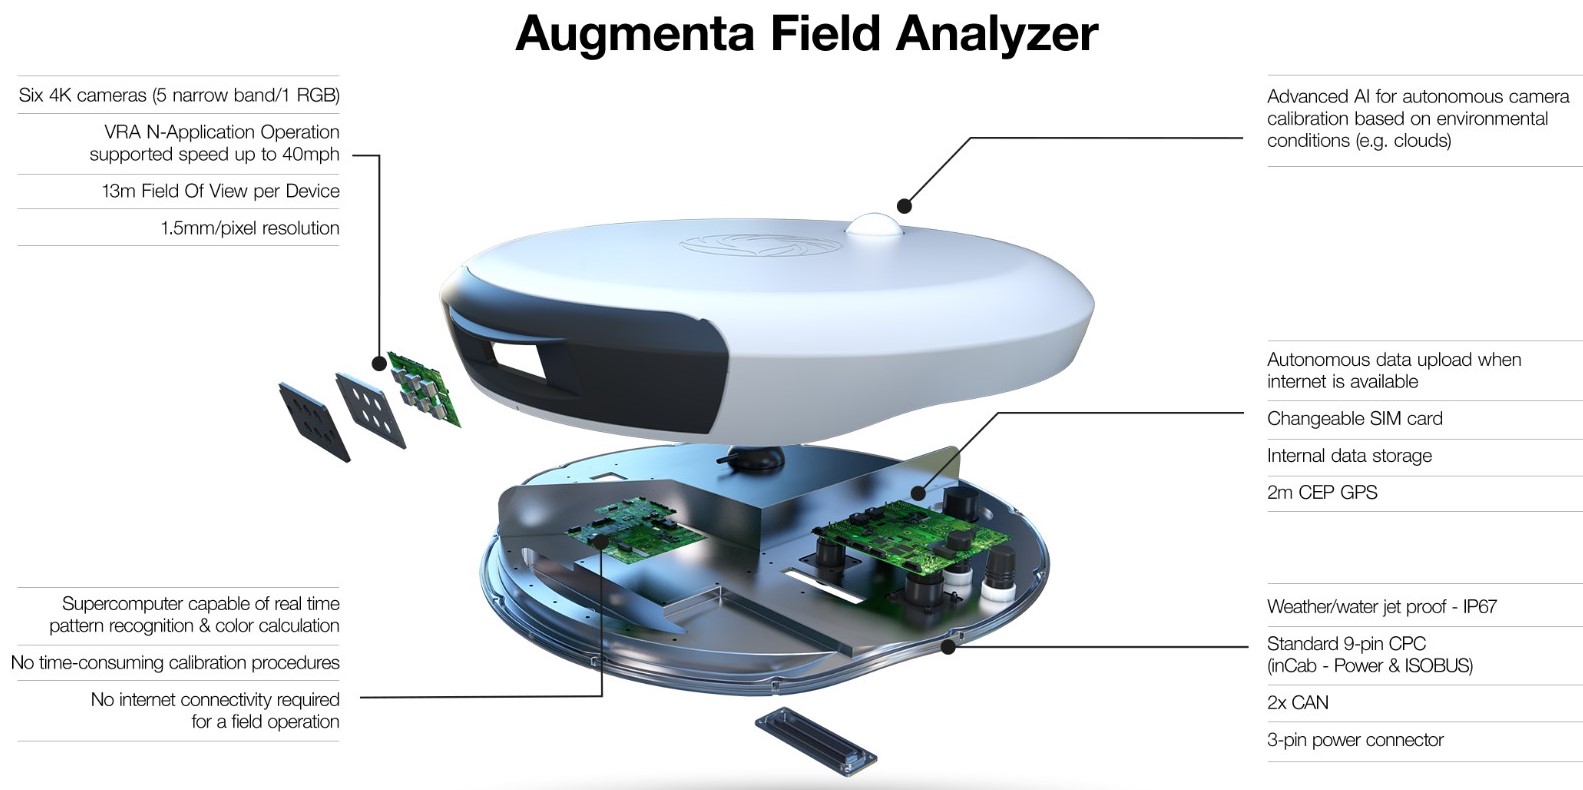
Hi Gialuca, I don’t understand some things because of the language translation, are you trying to make a VRA (variable rate application)? If so, how do you know which area needs how much nitrogen without a sensor? As for the actuator, I used Linak brand actuators, they have models with a potentiometer or encoder (hall) to determine a position, and you can get precise position, if you want, I can take pictures and share the internal structure of the actuator I have.
Ok, the sensor in the picture is not what I am going to use. I use a free web app Valle One soil which uses sentinel 2 data to make ndvi. The resolution is low ,10x10m, but with wheat barley soy corn, should be better than human eyes, which is what I do now. If I improve the ndvi resolution the better
Another option would be to leave the values 0 to 255. The app/ino that receives the pgn could interpret it as either the actual rate or a percentage.
For percent the zone most used in the field could be 100. In the zones to apply more they could go up to 255 percent.
An ino file could use the actual rate. There could be problems sending the actual rate with one byte if the rate applied is for example spraying at 8.7 US gal/acre or spreading a product at higher than 255.
One soil can provide shape files or kml files. Opening kml on Google earth doesn’t show coloured areas but only contours, whereas opening shape file on GE I see contours and colours.
From GE I could use snipping tool and save the image as Brian did once
I’ll convert the “values” to percentage. 0 to 200 percent. Then the ino can determine what the actual application rate should be. 100 percent would be the normal rate anything above 200 would require a double run.