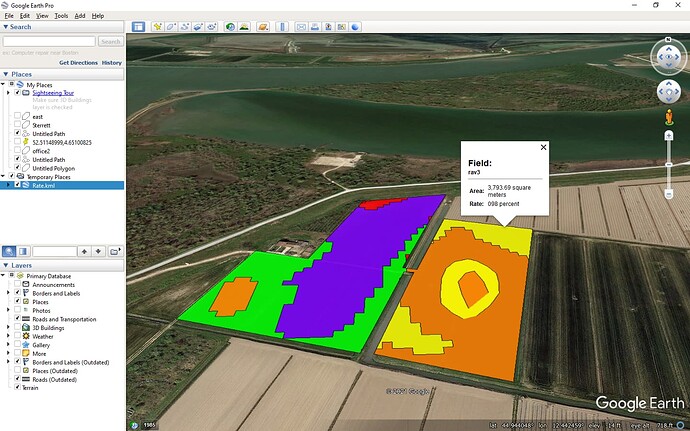
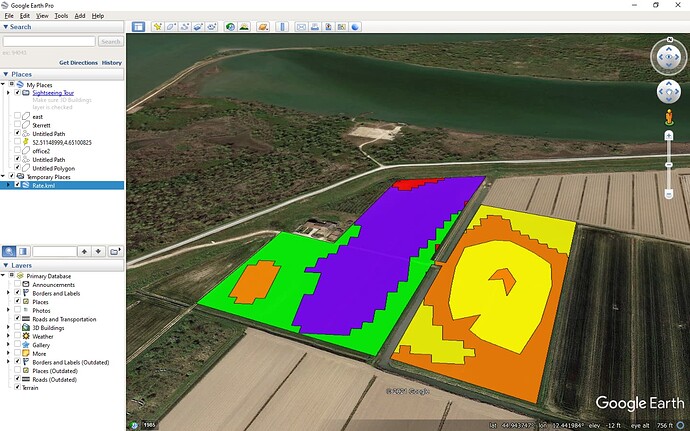
When I get it saving and sending the sentence, I will put it out for a trial run.
I think this would be a really great addition and big step forward for AOG. Know we have great autosteer and sectio control. But still need to run other monitors in cab for rate control flow monitoring etc.
Well it writes the rate map back to a kml file and this file can be loaded into a new field. Currently area includes interior areas of sub rates. But getting closer.
Rate.kml (15.5 KB)
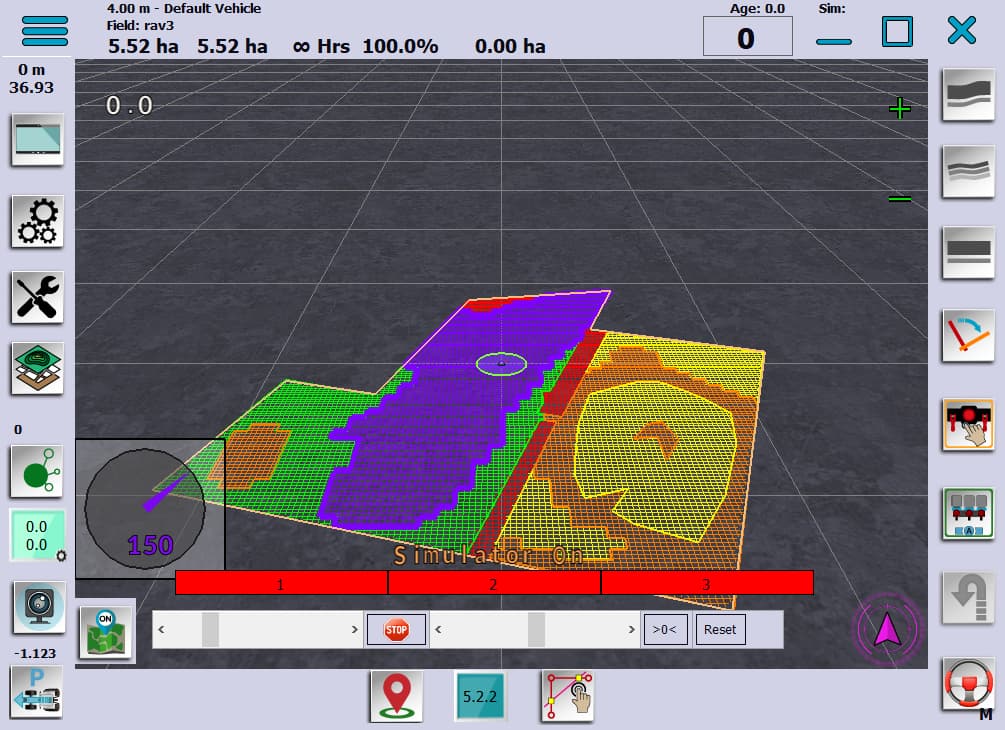
And I found that I can edit the shape in GE and reload it in AOG and it does change and keep the rate.
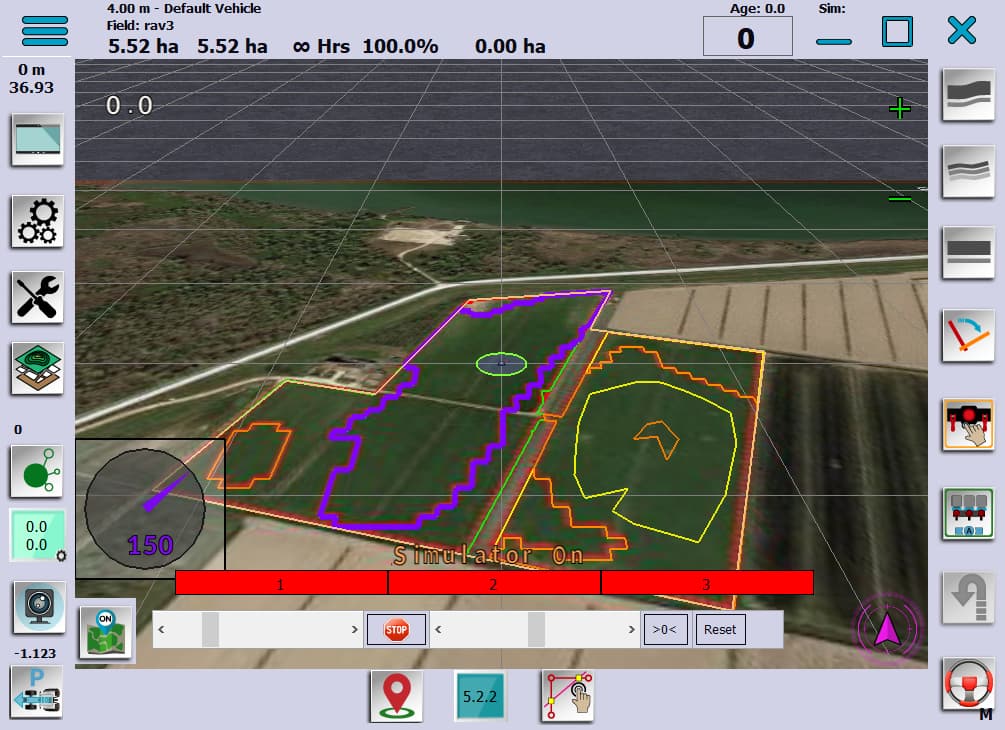
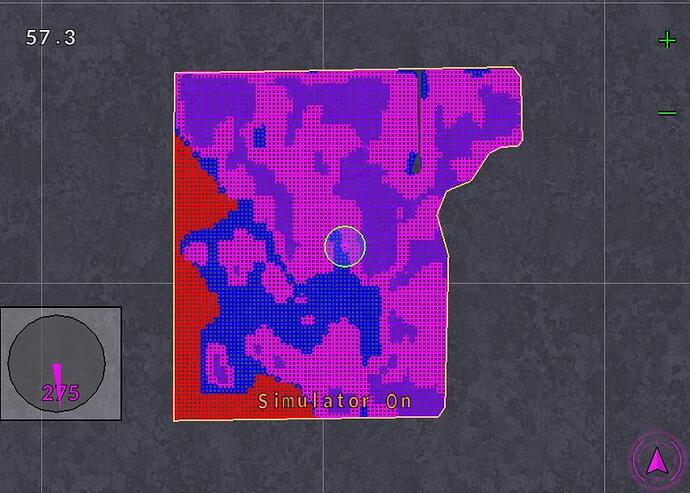
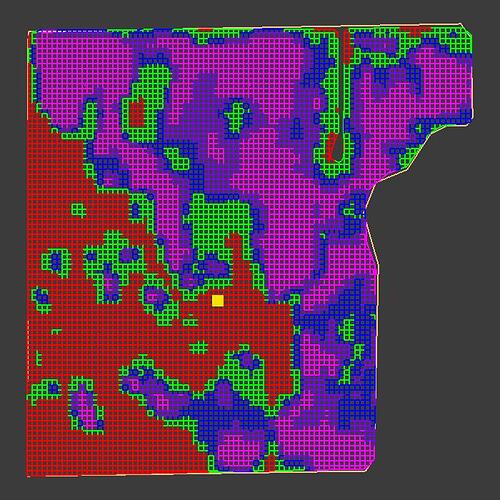
Inside AOG with Dots.
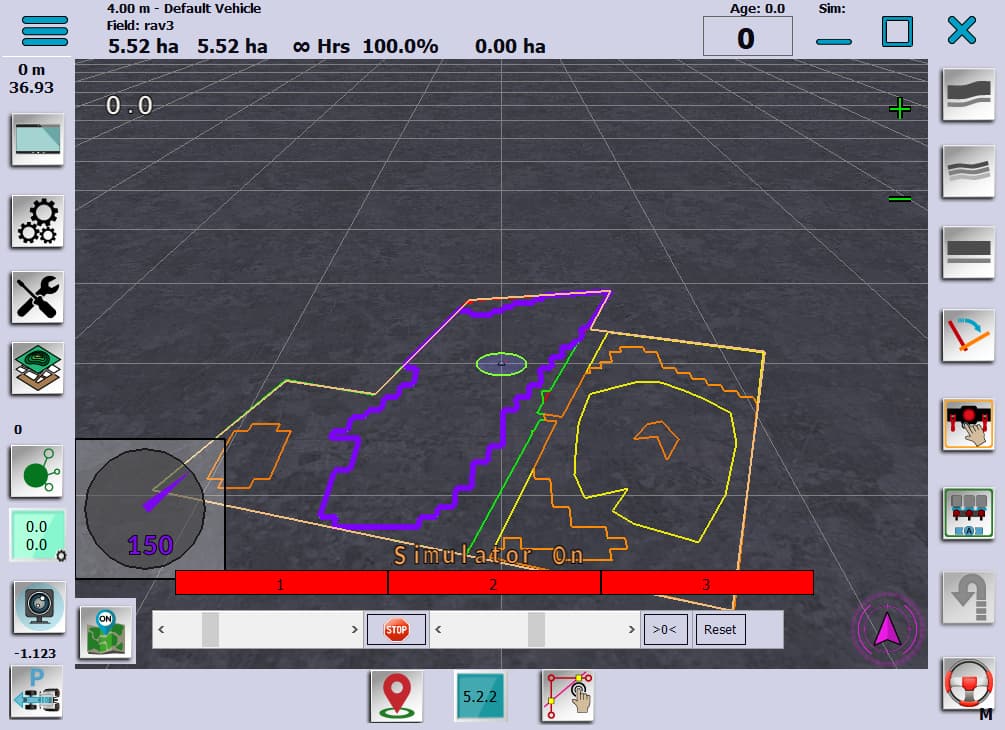
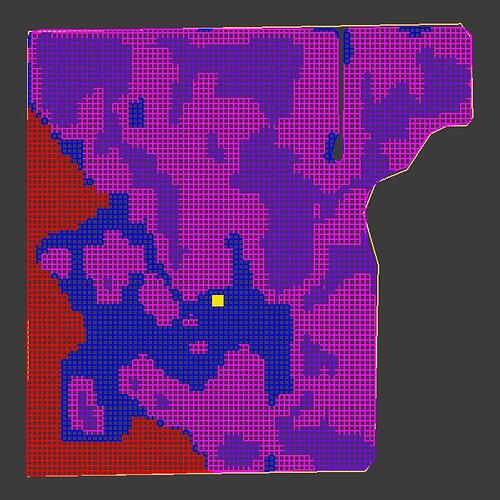
Without Dots.
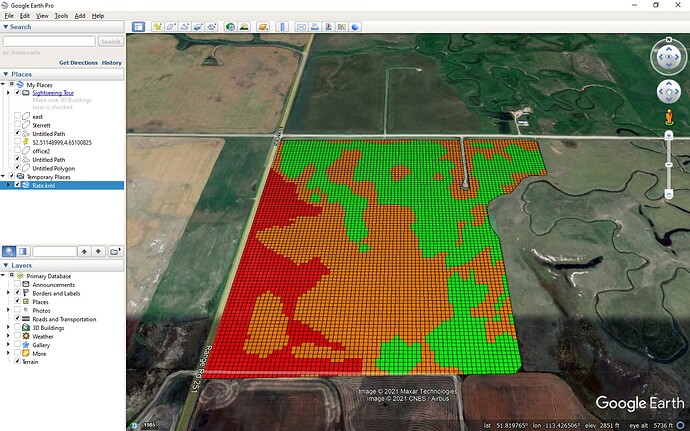
And with the background.
Now for the png sentence.
If current variable rate map building programs make a shapefile could that just be converted to a kml? I do think most of the shapefiles contain a rate not a percentage so would have to look into that more. I was just trying to think of a way to use this if my agronomist makes me shapefile VR maps
Export to kml appears to build inner boundaries. These would be duplicate if that is the case. Also, in what format is the rate saved? Is it and attribute, description, name, or what? If we did get the rate valuation import, it would simply be a pass through value.
@Mdmcurt have you a .shp file you can upload here? Like @KentStuff said, we need to know where the rate is saved.
@customfordfan 's .shp seem to be only random colors, it’s probably his .dbf file that contain the rate but seam to be proprietary.
@KentStuff Is inner boundaries a problem? If you look for the smallest area your in could you simply ignore the inner boundaries when uploading the .kml?
I am getting one to send, I don’t know much about them but will get one to load up herr
I found the duplicate problem and assumed it was reading an inner boundary. I think the kml file says inner. If so, then we can ignore it, maybe. We will need to know where the rate is saved in the kml file. Mine looks for the word percent and backs up four characters and reads three spaces. You can read the rate, you just must know what you are reading. 100 percent is 100 percent. But if I need to spray 1 quart per acre, or 10 gallons per acre, or put 3000 lbs per acre, that becomes difficult to code. Put the rate conversions in a secondary program. That’s my take on it.
I was also reading that you can convert a shape file to a kml, wonder what that would do with the info
Rename the file to shapefile.shp.txt. or just add .txt behind the extension. Then you can up load it here.
Fld6-VR Rx.shp.txt (881.7 KB)
Fld6-VR Rx.shx.txt (51.9 KB)
Fld6-VR Rx.dbf.txt (298.1 KB)
I had forgotten that there were the 3 different files when dealing with shape files. Hopefully these will help with trying to decifer info
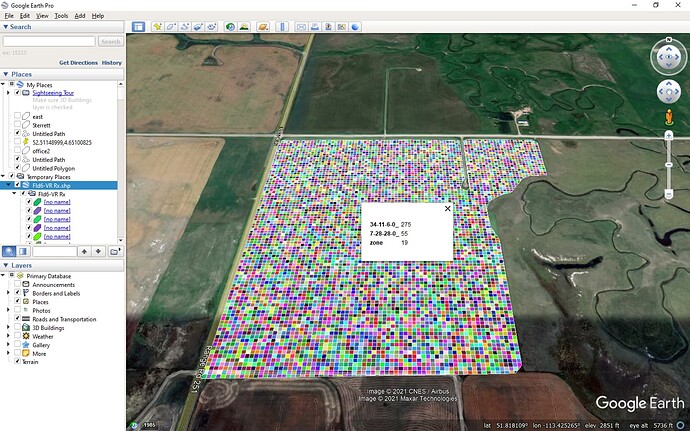
This is how it imported in GE.
Exported KML file. and found this to be the data. I do not know what these values represent.
<SchemaData schemaUrl="#S_Fld6_VR_Rx_DD">
					<SimpleData name="_4_11_6_0_">100</SimpleData>
					<SimpleData name="__28_28_0_">30</SimpleData>
					<SimpleData name="zone">11</SimpleData>
				</SchemaData>
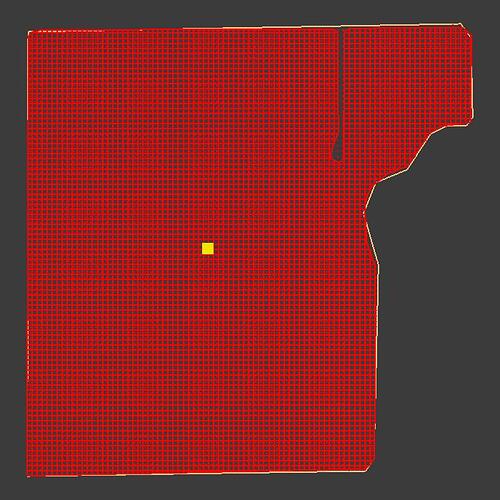
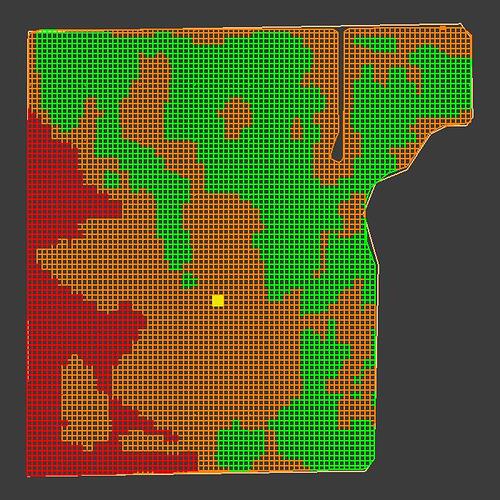
This is it in AOG all the rate set to zero on import. Actually thought it would slow down AOG but it did not.
This is it in ABDraw.
Having no idea how to get the data it read for all cases, this is the 4_11_6_0 data.
This is the second set of data.
And this is it back in GE.
3 data sets NPK??
That was my first thought. But I’m guessing.
If the zone is K, then this is the map of the zone.
So, we can import it. But you have to know what the inside of the kml file looks like.
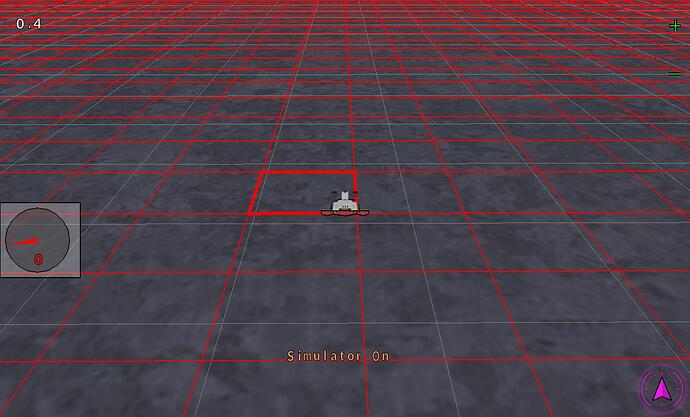
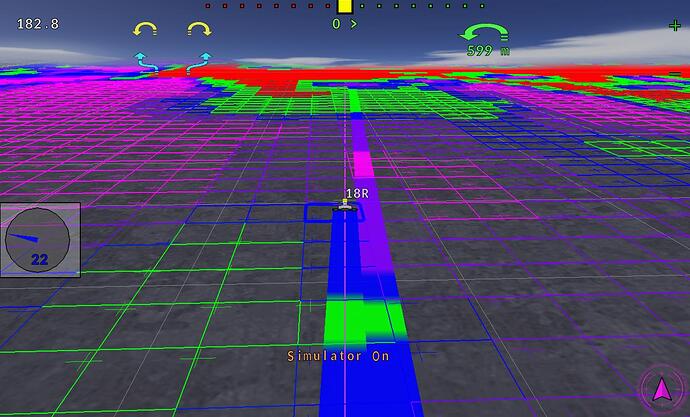
This is it painting.
On that first map those number would be the fertilizer blend and rate. The fert blend has 4 elements in its name so N,P,K,S and the blend percent of each with the 275 and 55 being the lbs per acre that is to be applied
Probably different zonal maps, one would be for nitrogen fertilizer and have a VR map for it the other would likely be for a starter fertilizer and have a different zonal map for it. Each map or layer would correspond with a tank on the cart and that tanks controller for Vr. I am guessing at this for most part as I have never broke down a shape file
My thinking was that the 34-11-6-0 was the name of the fertilizer. We have typically triple 13 (13-13-13) NPK. Then the Rx in the kml is the required applied rate. What I did not know is why the two different ones. Assuming just a better way to get an accurate blend. Either way, you would need at least two rates at all times for this field.
I think there is a rate for each tank/bin on the seeder cart. Most times here a certain fertilizer blend will go down into the seed row and another seperate blend will go down a different shank of the seeder. Also, sometimes certain tanks are not set as a variable rate but just set at a flat rate. This might be a 3 tank cart 1 for seed, 1 for seed shank fertilizer and 1 tank for the fert shank on the drill. Seed was probably a flat rate across field, the other 2 maybe VR. All have to be set in display because controllers on tanks will be looking for a rate to apply
How many rate data lines should we read? How many do we display at one time? How many to we send out of AOG? Given the formats above, I can now read all of them. We no longer have a problem with the innerboundary It just ignores them because the rate information is in the outer boundary. Just need to subtract the inner areas from the outer.
