Or two points and main + cross slope.
Three pts could be an option too.
Or two points and main + cross slope.
Three pts could be an option too.
First map test using my UDP-based simulator. Andy
We only set 1 point (or average several readings but it’s only 1 point), then slope percentage and heading degrees or dual slope percentages on N/S & E/W headings.
That’s when the British drew the lines in North America.
In any other part of the world there will be few NS or EW lines.![]()
It comes back to use a guidance line to give the slopes. Either A+heading or AB
Should the arrow be scaled to the size of the tractor (so it gets smaller on zoom out) or stay the same at all zoom levels?
Andy
Getting smaller to a certain point.
Also a line for the blade edge.
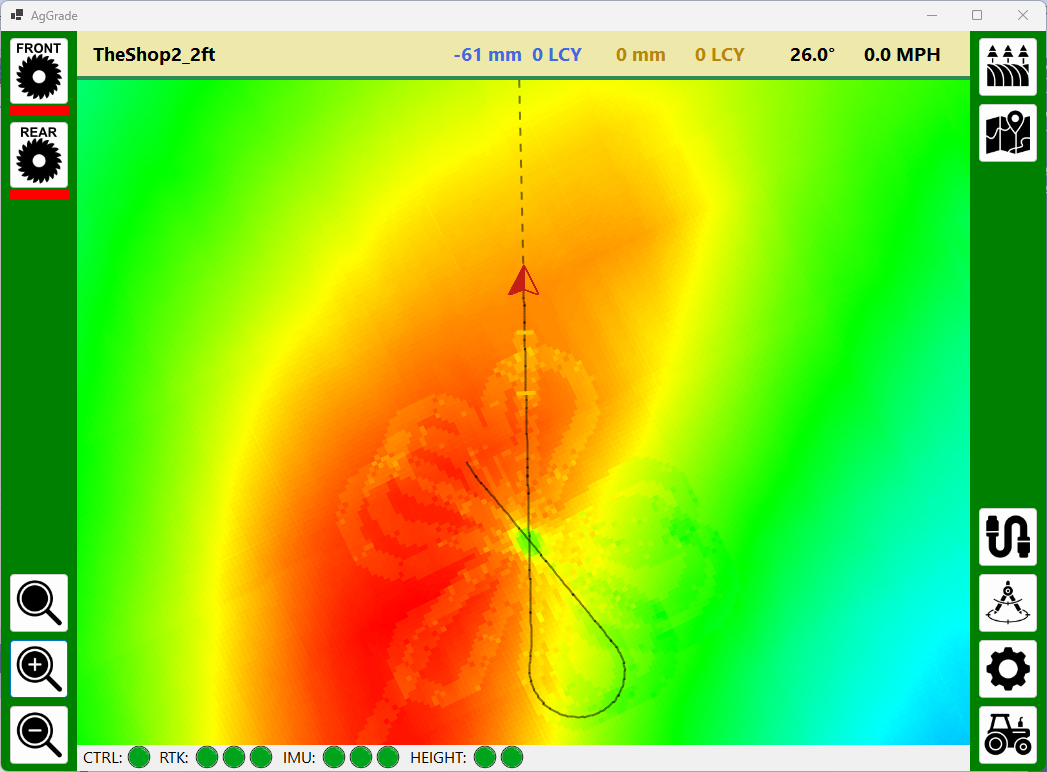
40ac field. Uses dead reckoning for smoother update. Renders benchmarks. Shows a recent path and a projected heading. The scrapers are shown actual blade width. The arrow is the width of the tractor.
Feeback and suggestions are welcome.
Andy

Are you going to have a tab with display windows of cutting data? Also would recomend adding the classic OpenGrade survey and cutline style of control. Even if you don’t foresee needing it in your case. You always need to do a little odd job here and there
What cutting data would you like to see? Surveying will be added (top right button - looks like a field). Yes, I am open to all suggestions but for those things I don’t need myself I would need others to test for me.
Andy
Not sure if you are familiar with Open Grade 2.1.3. No offense if you know all this, but I will walk though it.
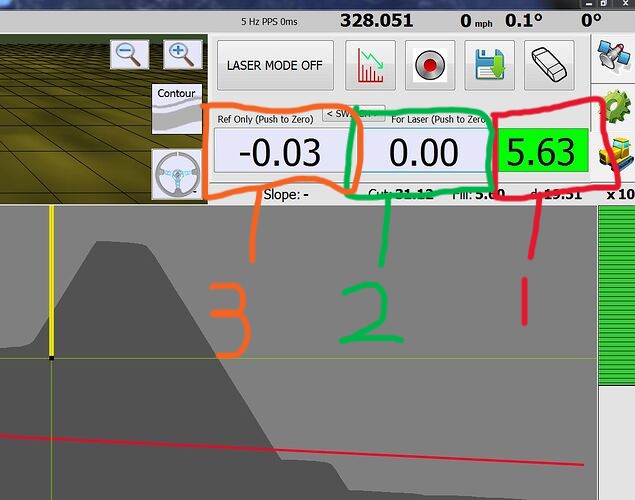
@Pat v2.1.3 is the most common OG in use to my knowledge. I include link to it as well. For manual operations the lower tab in the upper right hand corner is the most used (dozer tab). In this tab you see your surveyed slope profile and your cut line drawn in the satellite tab.
Also here are the heart of operation, window 1 in image is the cut window it displays your distance above target, or below, it also shows green or red background.
Window 2 is 1st zero able window, pushing this also will zero at any time, this is also the elevation displayed in cut window if Laser Mode is selected.
Window 3 is the 2nd zero able window, it can also be switched to the 1st position by hitting the switch position
What would be nice is a 4th tab in this version. This tab would have these 3 windows in as large of a size as possible. When out in the field it would be ideal to have them large and easy to read
Hope this was understandable. Obviously you have started fresh so I don’t know your intended layout.
Thanks
Ok thanks! I will take a look at that screen. Andy
Some more progress. Cutting with front blade and then rear blade. Andy

My survey file has benchmarks like this:
xxxxx, xxxxx, 30.480,,,0MB,
I didn’t do the survey and I don’t know whar equipment was used. Am I right in thinking that before I start leveling I need to:
?
How often does this need to be done? Once per field leveling operation? Once per day?
Thanks, Andy
Pretty much except it’s more for XY. For the height you can basically check anywhere where the cut/fill is 0.
And you will check vertical offset way more frequently than the horizontals ones.
The benchmark is simply a known position you put in in your survey so you can realign the map if you work with a different (or restarted) base station.
It’s to precisely align your map so you don’t have to guess, mainly horizontally.
To be done only if you have doubts about your horizontal positioning.
Thanks Pat. So… the benchmarks are not physically marked, which makes them useless for X/Y and I didn’t consider that. I guess I will need to create my own benchmarks for the duration of the leveling.
Andy
Optisurface has a haul path analysis, but there doesn’t appear to be a way to get it out of the application. One of the many, many frustrating shortcomings.
However I can zoom in and export georeferenced images, which is PNG and KML.
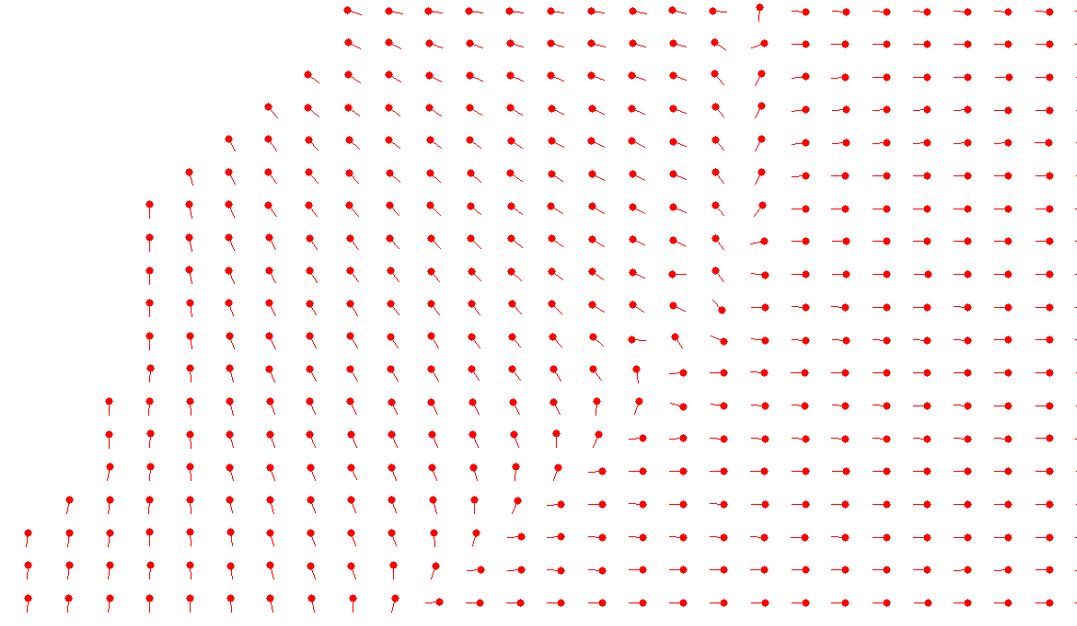
I then used AI to write some code to take a set of georeferenced images and create a CSV with lat, lon and direction for each of the haul arrows.
I then had AI write some more code to take the CSV and generate a verification image so I could confirm that the CSV was correct. This image uses dots and lines instead of arrows.
Tedious but now done. Andy
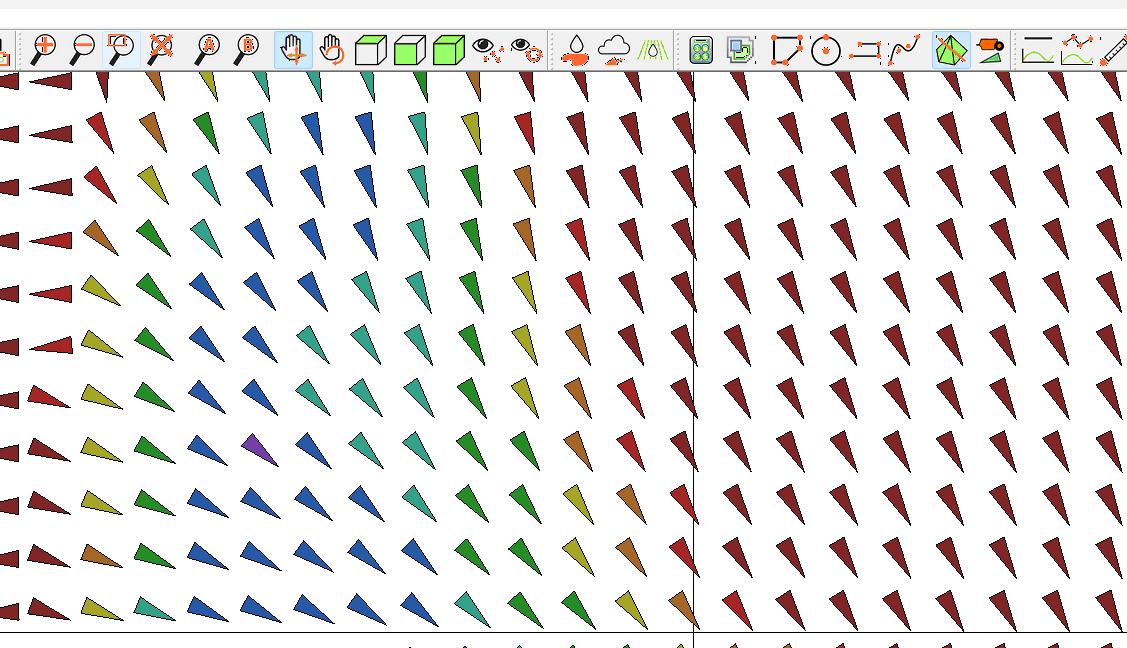
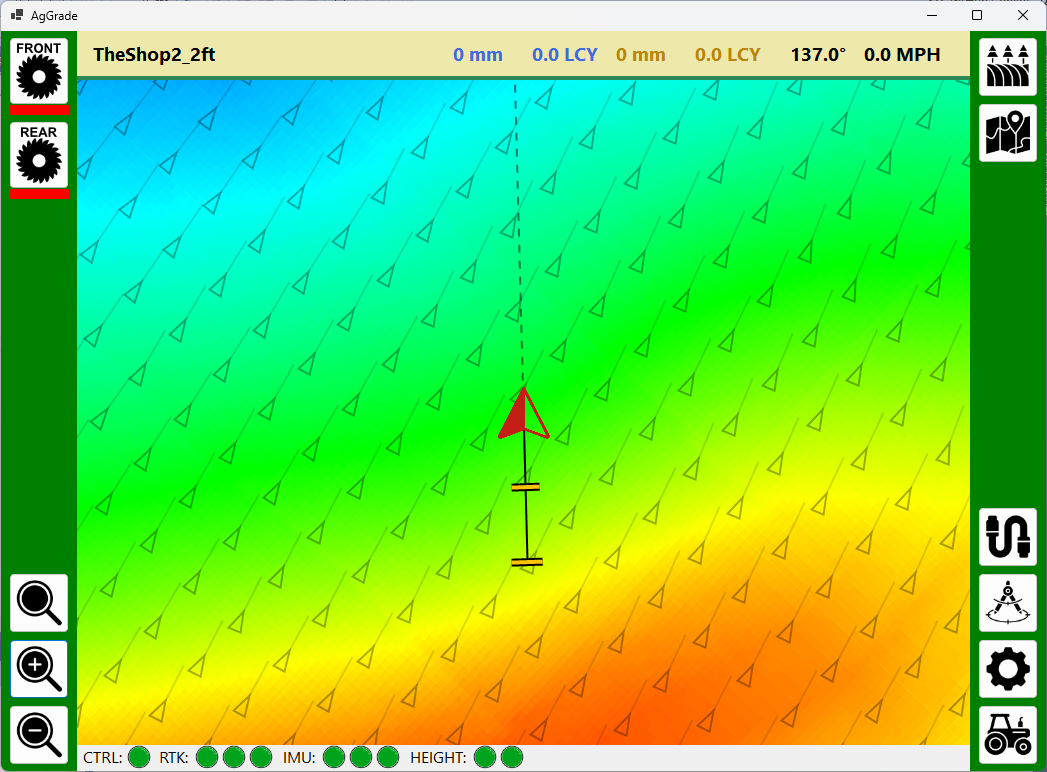
Added the Optisurface haul arrows to the AgGrade map. Andy

To my eyes the way these triangles in Optisurface line up makes me think the haul path is a straight line due south, but they are not.
So in AgGrade I added small lines from the ends of the triangles to make the direction clearer. Andy
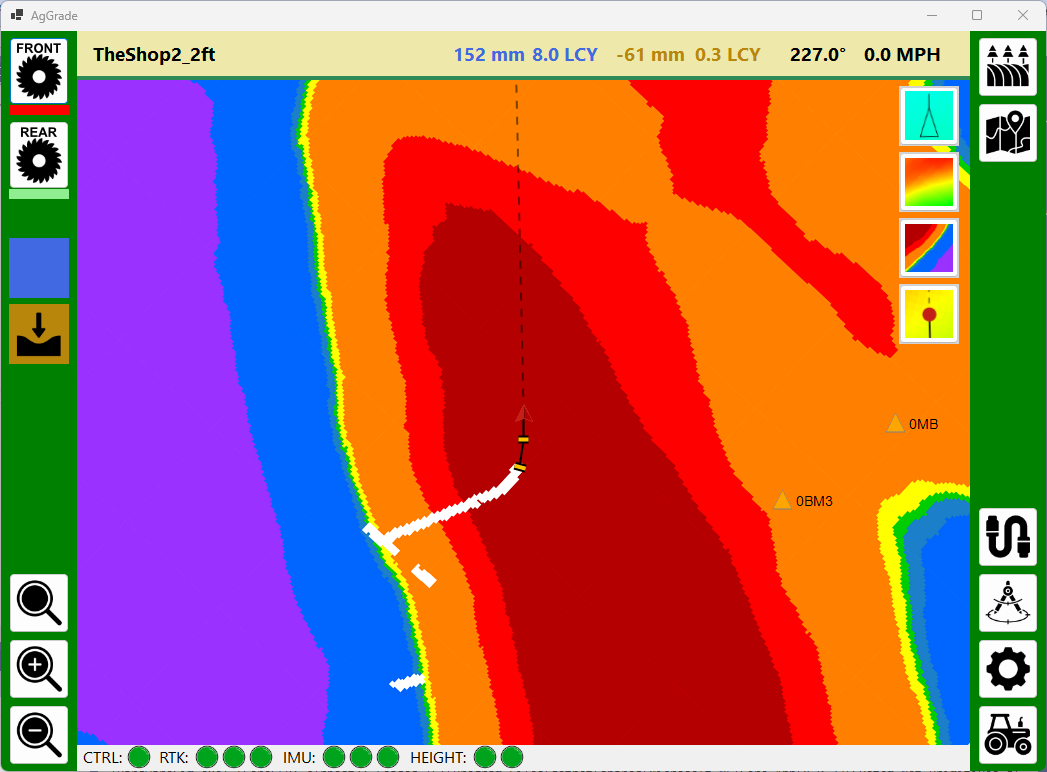
Added some more functionality.
Now possible to toggle between the smooth elevation map and the cut/fill map.
The haul arrows can be turned on and off.
The tractor icon can be toggled between an arrow and a dot.
There are two dirt pan indicators on the left showing what each one is doing - cutting, filling or nothing.
The cut/fill map shows white where a cut or fill has happened. I am not sure yet what to do here. Should these fade over time? What would be the most useful display?
Andy