It wouldn’t have happened if i was the best - but thanks !
You need the SHP, (and preferably also the SHX) and definitely the DBF. An SHP on its own is useless.
DoseNdef.zip (43,3 KB)
I hope that GE like thi file…
No, because it’s still only the .shp file. Include the shx and dbf.
Here it is.
I’m sorry for my low level of knoweldgment about informatic, software and also elettronic hardware.
Risicoltore bis.zip (44,2 KB)
Perfect, thanks ![]()
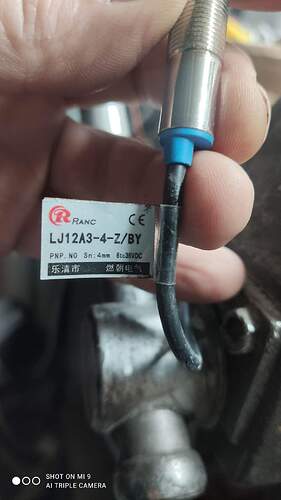
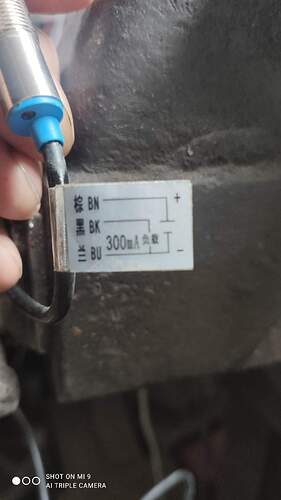
Hello maybe someone can help. I have such a sensor from 12 to 36V, how to connect it to count the revolutions of a dc motor. Thank you
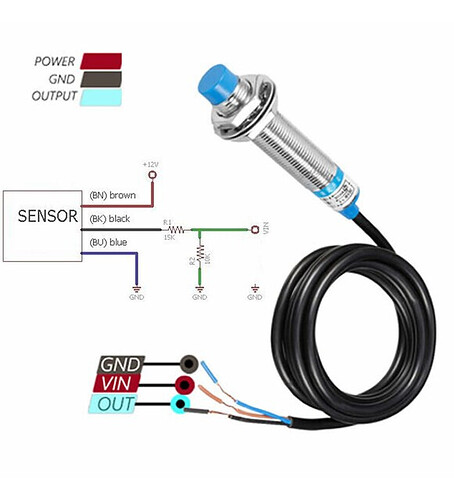
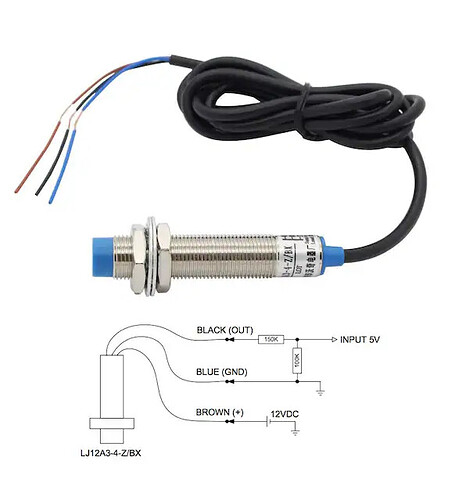
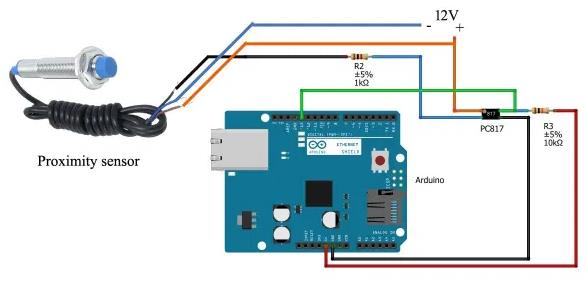
It looks like an inductive sensor, that is, when it detects metal (the distance between the sensor and the metal is 4mm) it gives a positive output, because the sensor model is PNP, you CANNOT connect the output pin, ie the black wire, directly to the digital pin of the microprocessor, because a voltage higher than 5 volts to the processor input.
When voltage comes in, the processor will be damaged, remember that some processor inputs are 3.3 volts. If you are going to use this sensor on Arduino, you can reduce the voltage on the output pin with the 7805 regulator and connect it to the processor input, or you can reduce it to 5 volts by using suitable voltage divider resistors, you can use an optocoupler as the last option.
BN (brown +12V DC), BU (blue GND), BK (black-out pin)
Thanks for the information
7805 datasheet does not say anything about rise and fall time so is it suted for a frequency signal?
A voltage divider is a cheep and easy solution, another solution can be a optocoupler, with a optocoupler you have isolated the cutits so you not can get overvoltage into the microcontroller
40-50 Hz with 7805. I remember how good results I got, I used it 2-3 times.
Thank you for your patience.
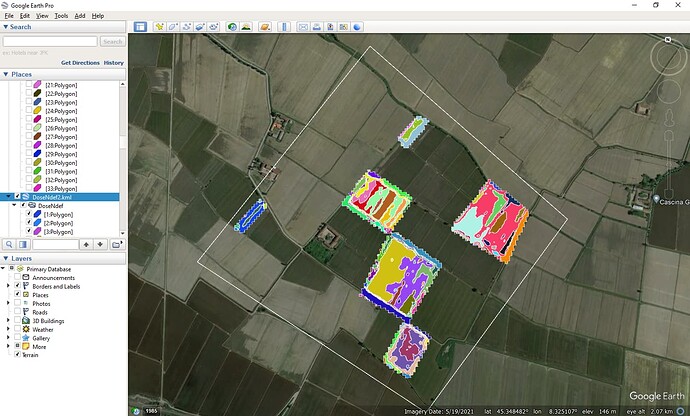
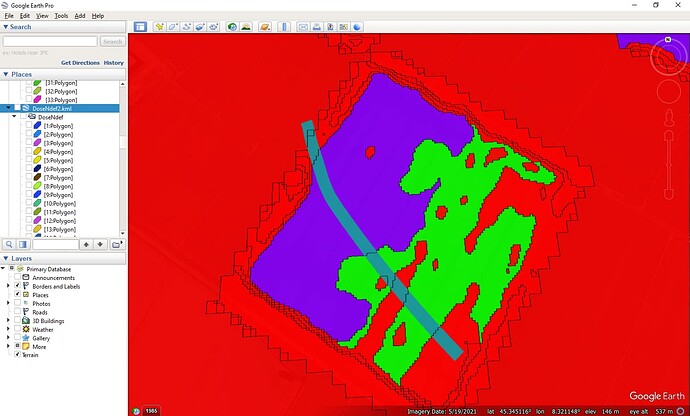
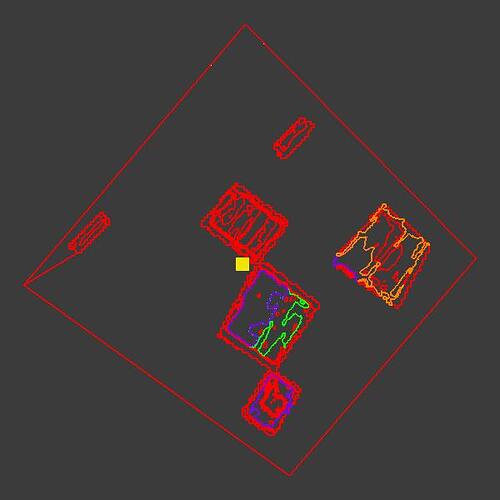
This is the broken apart kml that GE created.
DoseNdef2.kml (860.3 KB)
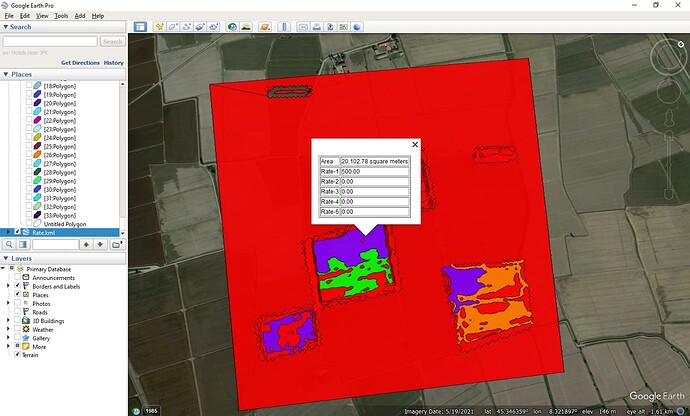
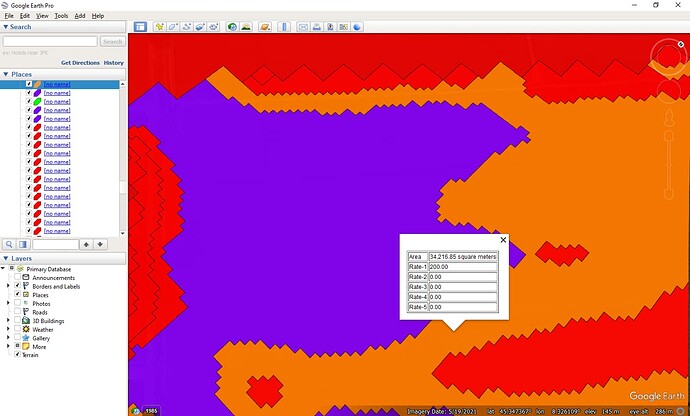
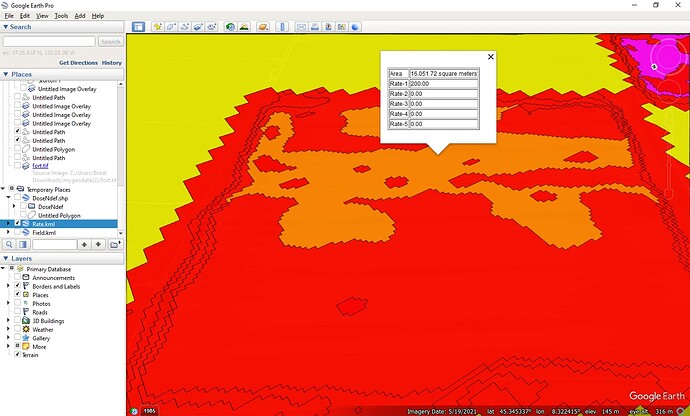
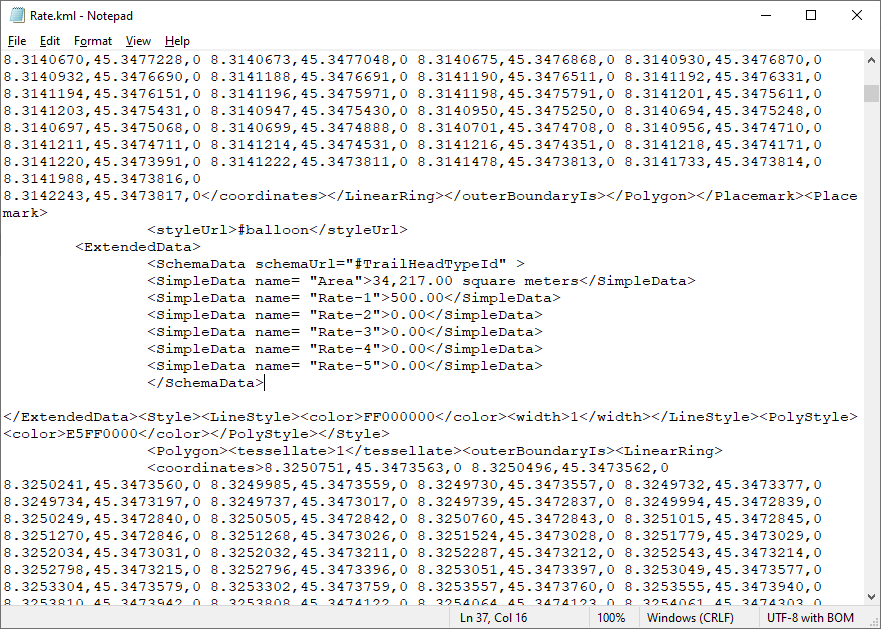
This is the Rate file that AOG rate created.
Rate.kml (641.8 KB)
AMAZING!!!
now i have to understand where i make mistakes.
I think that have a lot of work to do…
Stupid question:
Where i can found a tutorial to do the proces to obtain a result like your?
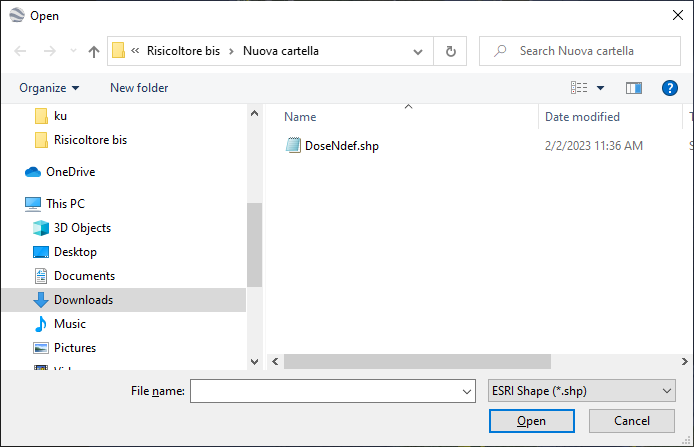
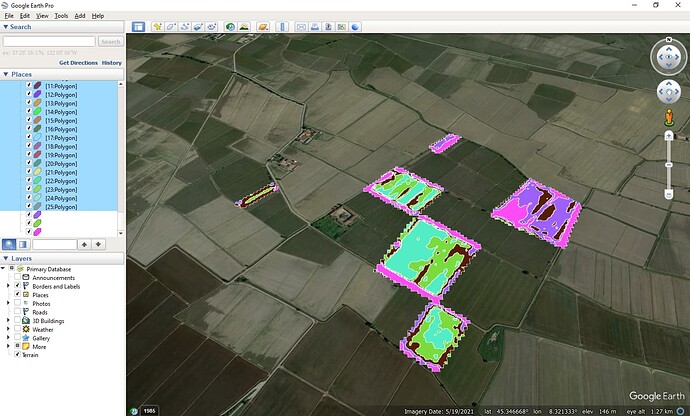
Open Google Earth. File import. Change search type to .shp.
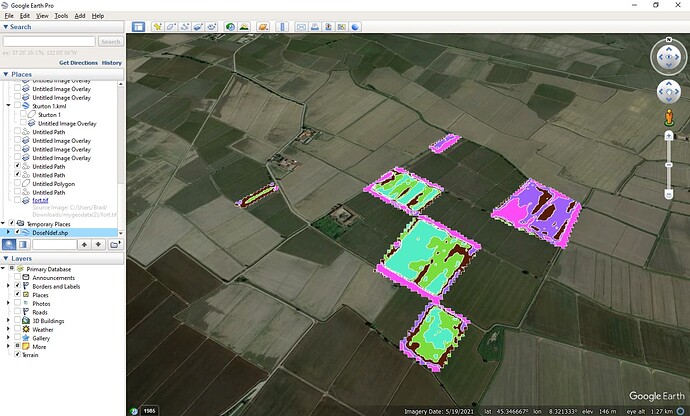
Click on your file. This should fly to your field.
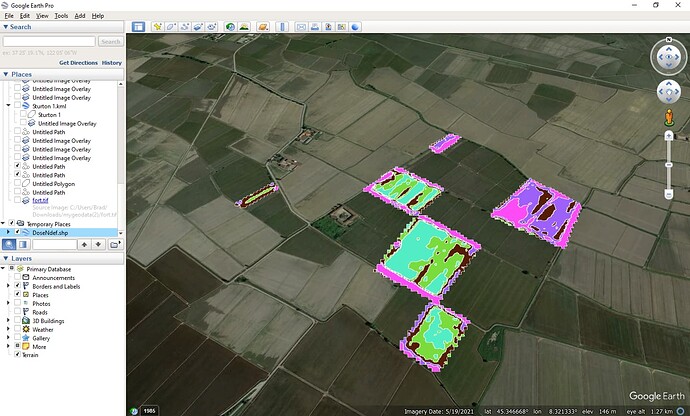
You must turn the shape file on in the left menu to see it.
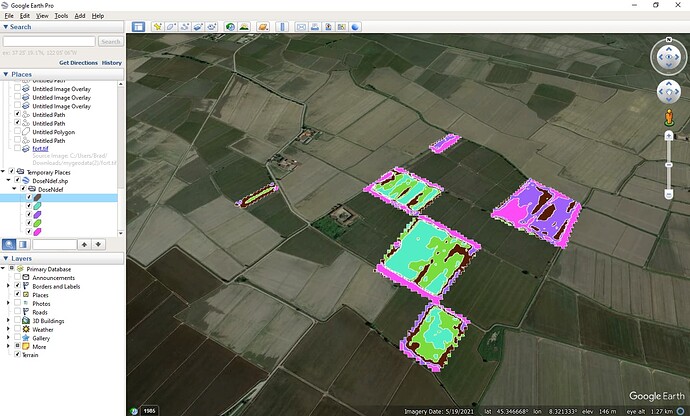
Click to item to see the lower items.
Right click each item to split multiple items.
Do this for each of the lower items.
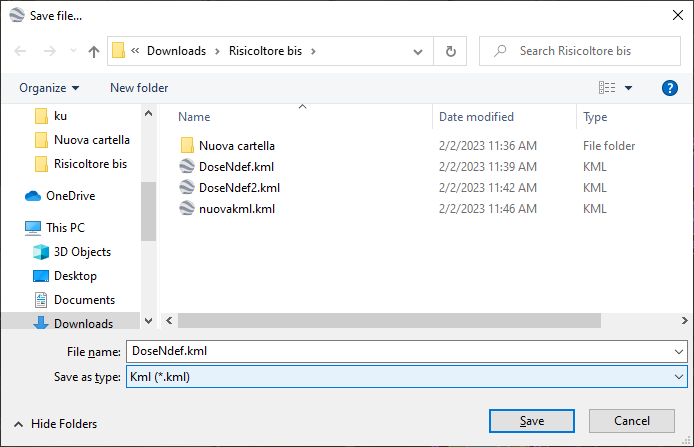
Then right click on main item and click save as. And then choose kml.
You get this far, we will continue. This should build your kml file from the shp file.
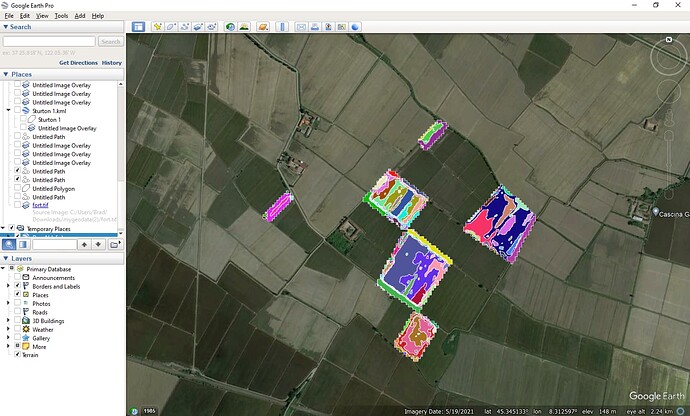
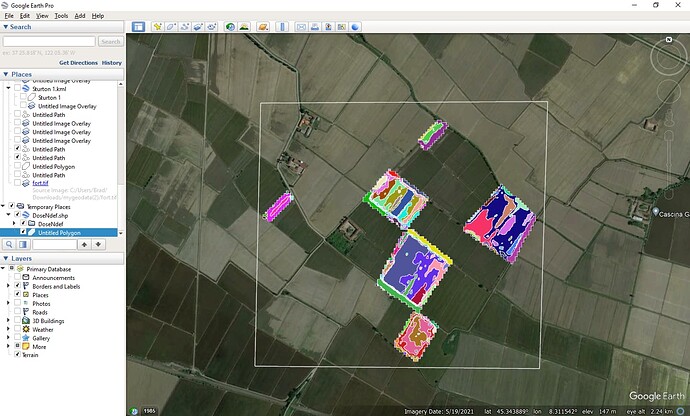
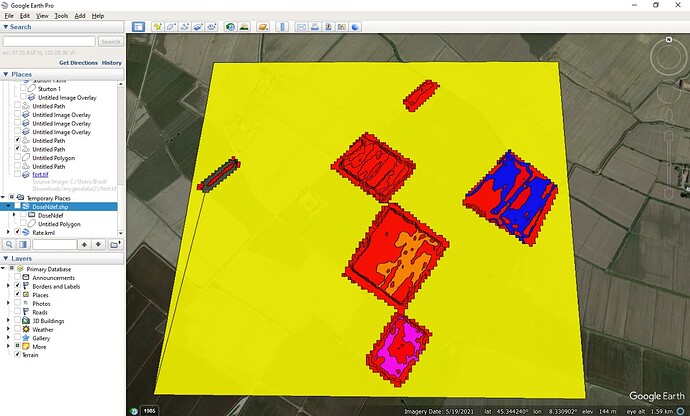
If you have successfully gotten this far, close GE. Go to where you saved the kml file and click it to open GE. It should look like this.
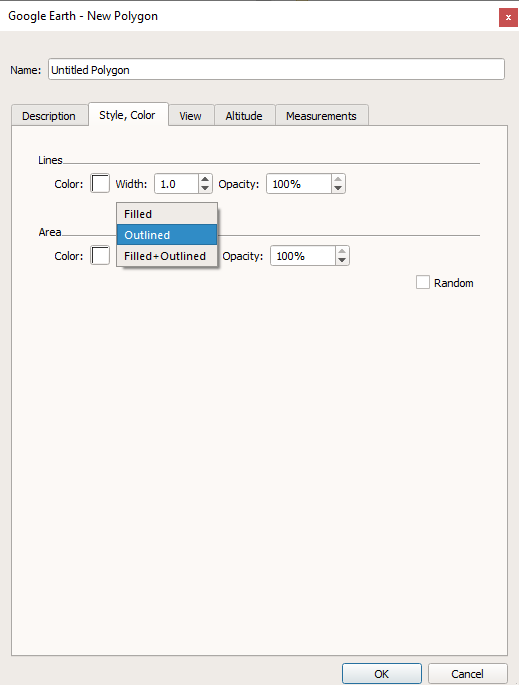
I chose to build a large field around the whole group. Top of the GE screen add polygon. Click the four corners. While in the polygon builder, click outline only. And click ok.
You should have a rectangle around your field.
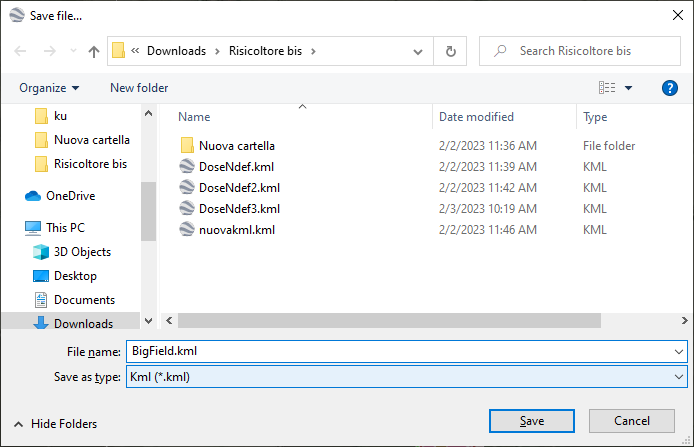
Now click on the left side of the screen where this new polygon was created and right click on it to save as .KML. Make sure you save to kml not kmz. We did this before, but because you have closed and reopened GE it resets to kmz.
Close GE, it is no longer needed. Now you need to open AOGrate from the above link. I will repost that link later. If your start up screen does not look like this you have the wrong version.
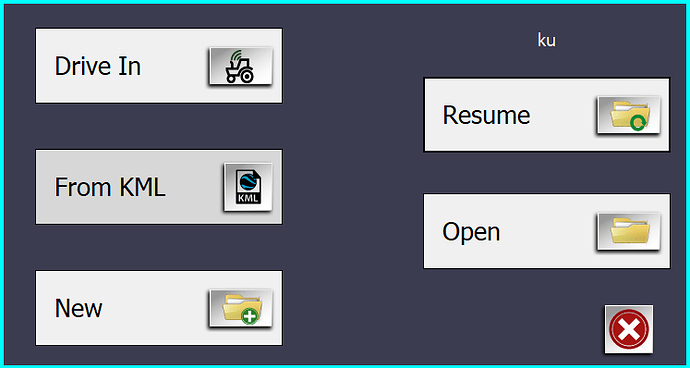
Click the field button. And from kml.
Give it a name and the little kml button will let you click it.
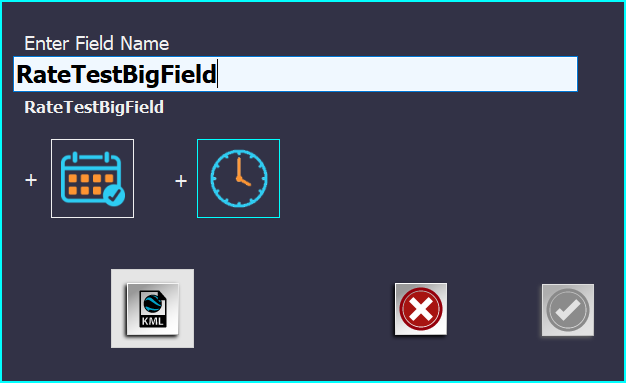
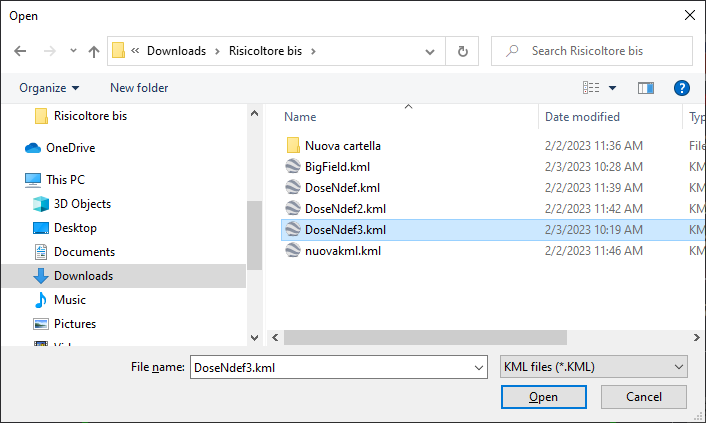
Navigate to the location you saved the Polygon (Big Field in my case)
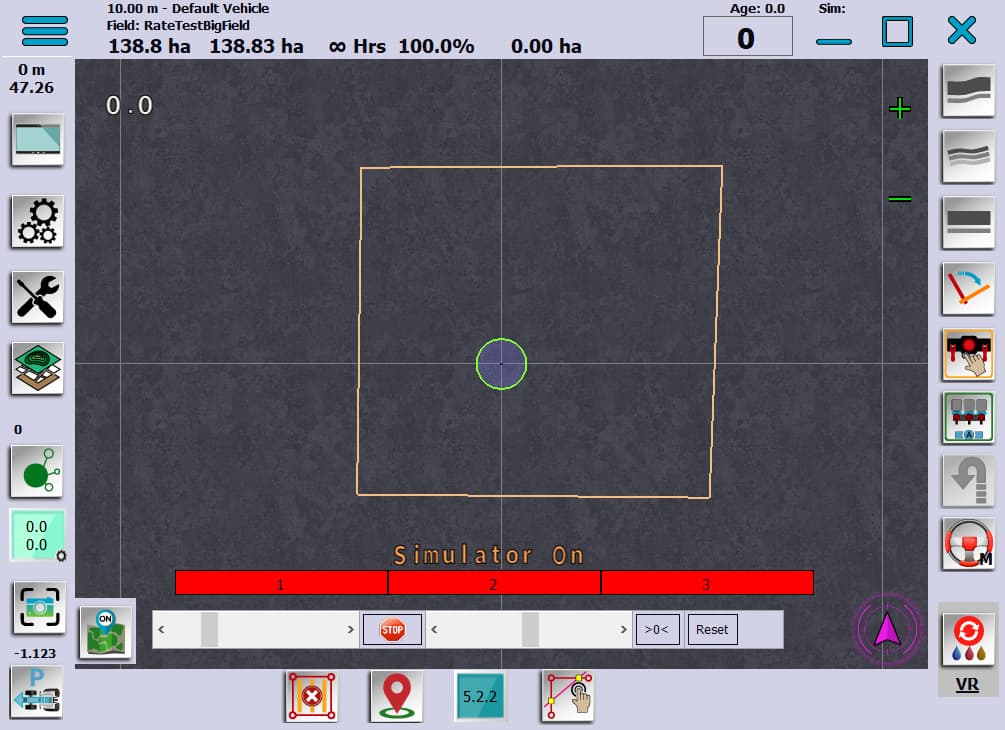
Screen should flash and click ok and your field should be on the screen. You may need to zoom out to see it.
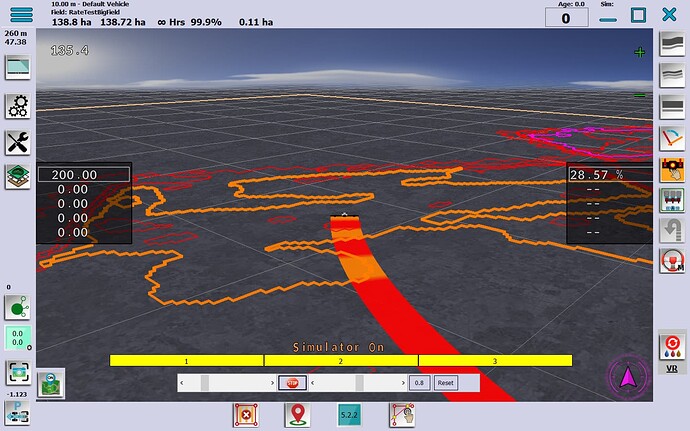
Now click the little button lower right corner that has the paint drops and VR.
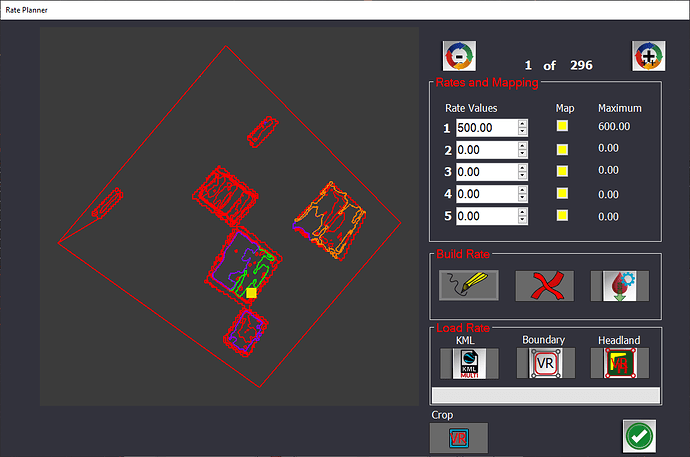
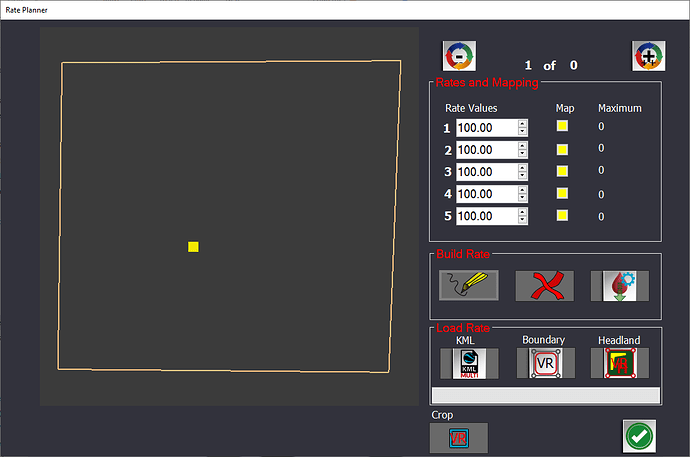
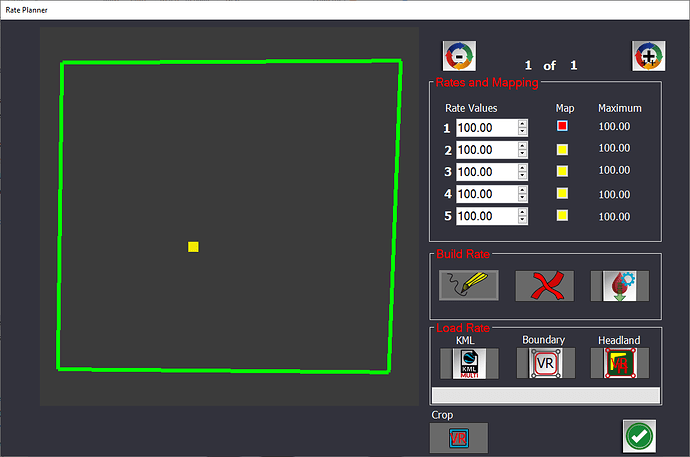
We are ready to add the rate areas. The values in the little boxes are what gets applied. Click the boundary button at the bottom and the the right button beside the funny looking X and then the whole boundary area now has a rate. Now click the top map button. We should be here.
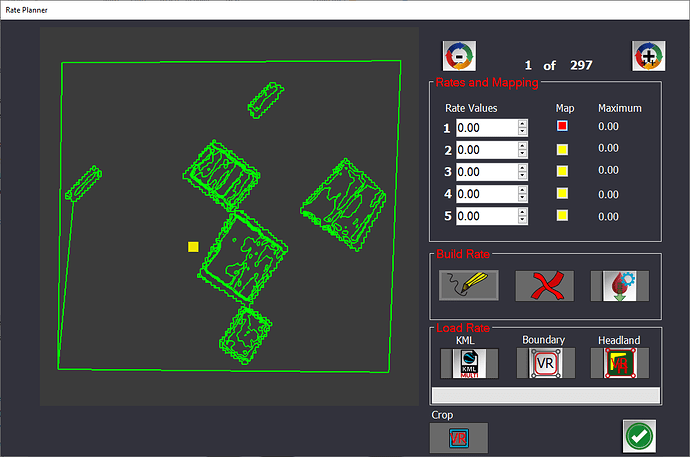
Now lets load the rate areas. Click the KML button and load your multi rate kml that you built earlier.
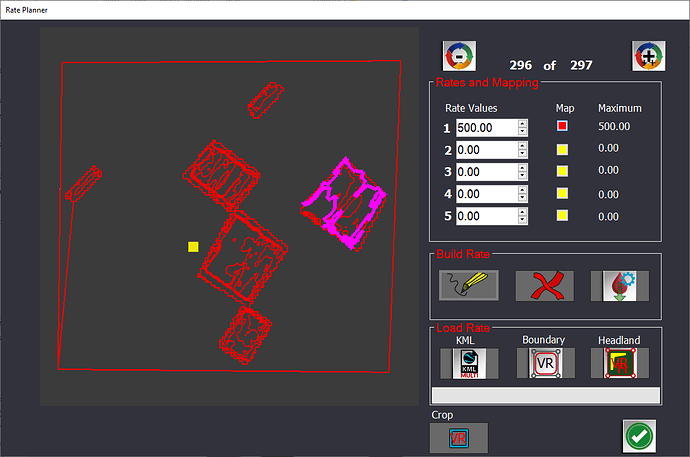
Areas are sorted from smallest to largest. Click the - button at the top of the screen to get to one of the larger areas. It will highlight the area you are going to apply to. Let us set the 296 to 500. So type 500 in the first box. You can set the other boxes as well. Then click the apply rate button, the one right of the funny X. and it will apply the 500 to that area. Everything should change colors. It maps from max to min.
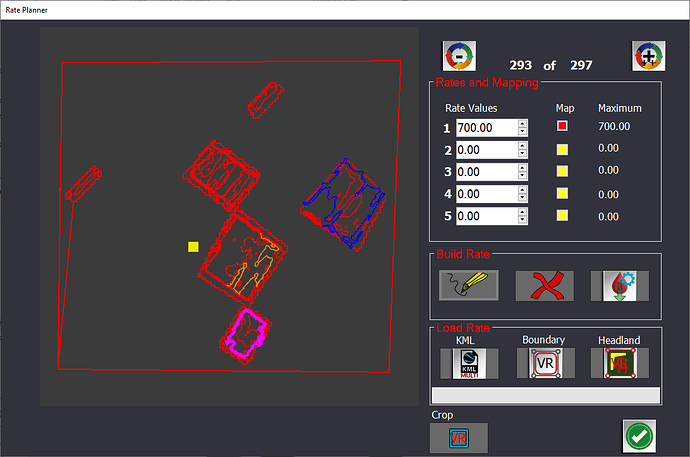
Do this again for 295 and 294 and 293 giving it values of 50, 200, and 700.
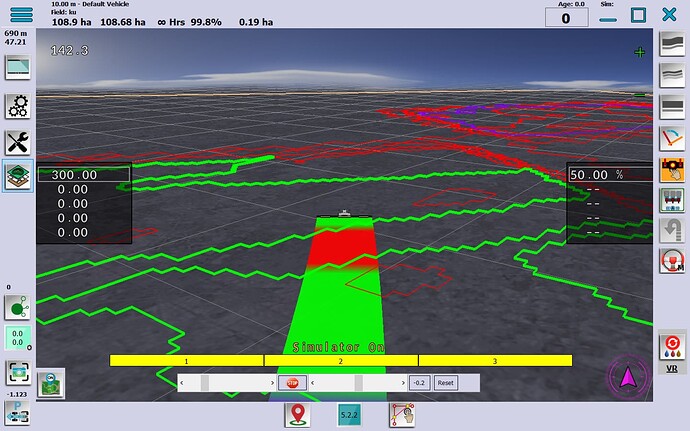
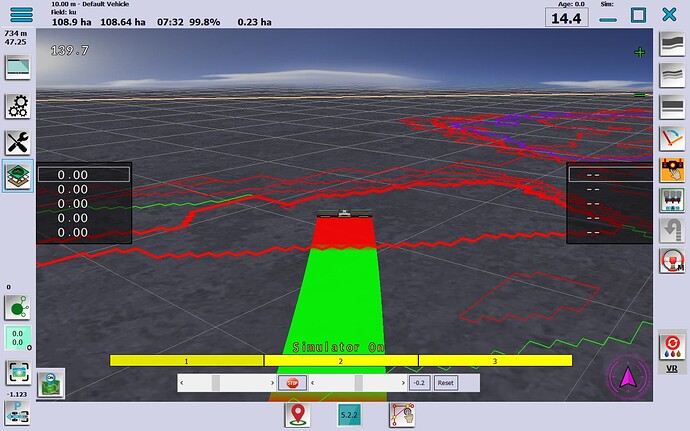
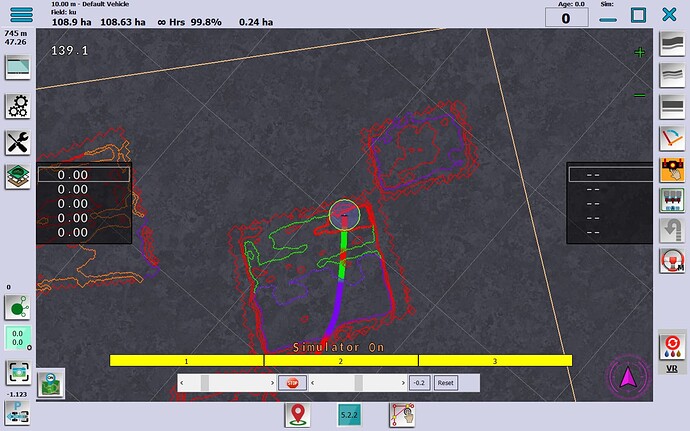
You do this to all the rates you want. This is a large number of rates but this is how it works. You can also draw areas, headlands and other. click the check mark and you are back in the field. I forgot to apply a rate to the boundary. Go back in to the VR and set to the highest number 297 and give it a value of 300. Now when you are not in an area the rate should be 300. Start painting and drive over the areas and the rates will change.
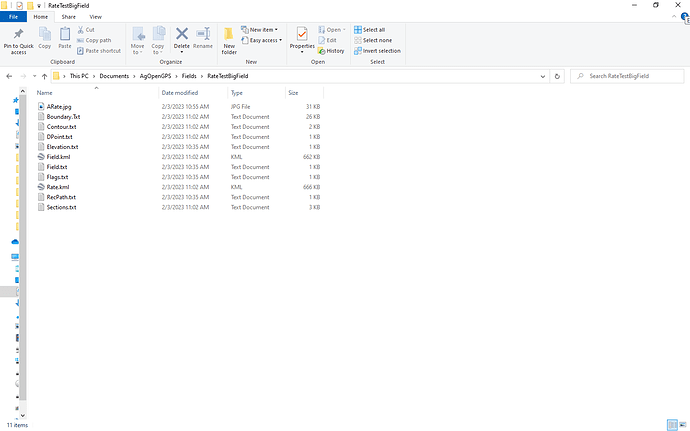
That is it. AFTER YOU CLOSE AOG, In the field folder you should have other kmls and jpg files of your rates.
A lot of steps, but it does work. When you reload the field, and then load the rate kml the saved values come back. It saves the data in the rate.kml.
